matplotlib画图总结--多子图布局
1、subplot布局
subplot(nrows, ncols, index, **kwargs)
subplot(pos, **kwargs)
subplot(ax)
x=[1,2,3]

values = [10, 15, 25]

p1=plt.subplot(221)

plt.bar(x, values)

p1.set_ylabel('yy')

p1.set_title('p1')

plt.subplot(222)

plt.scatter(x, values)

plt.subplot(223)

plt.plot(x, values)

plt.suptitle('subplot')

plt.show()
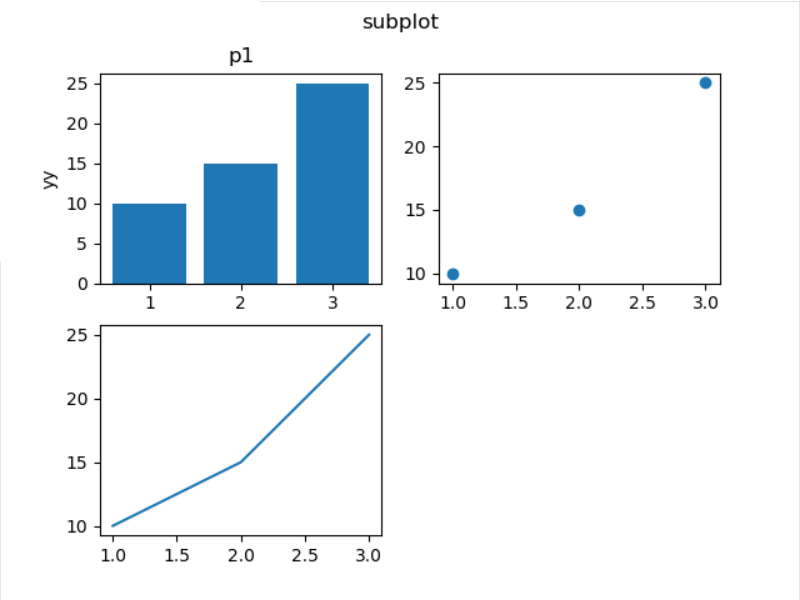
上面的图第三张只占半个图纸长度,不美观。那么使用subplot怎么画非对阵图呢?重新定义子图的分布行列即可。
plt.subplot(212) 或plt.subplot(2,1,2)把图纸分为2行1列,当前子图是第二个。
x=[1,2,3]

values = [10, 15, 25]

p1=plt.subplot(221)

plt.bar(x, values)

p1.set_ylabel('yy')

p1.set_title('p1')

plt.subplot(222)

plt.scatter(x, values)

plt.subplot(212)

plt.plot(x, values)

plt.suptitle('subplot')

plt.show()
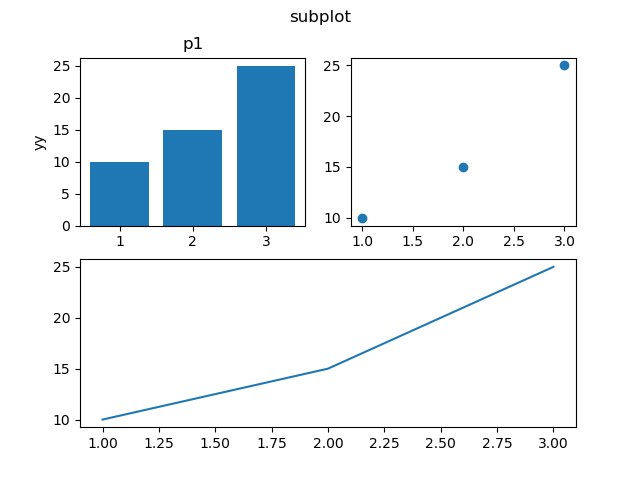
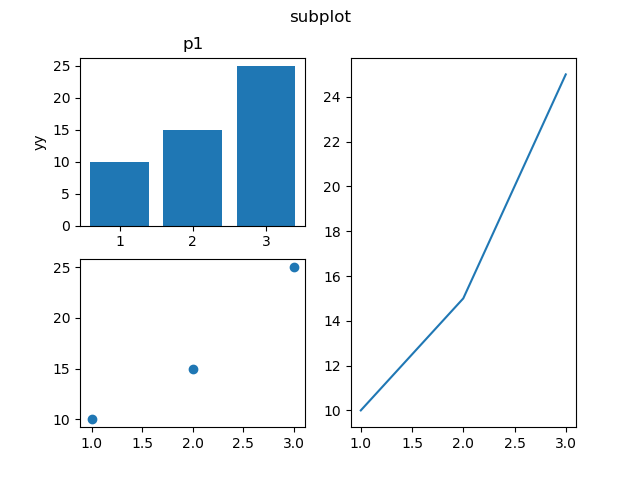
先把图纸分为2行2列,先画图1和图3,然后再把图纸划分为1行2列,对第二列绘图。
x=[1,2,3]

values = [10, 15, 25]

p1=plt.subplot(221)

plt.bar(x, values)

p1.set_ylabel('yy')

p1.set_title('p1')

plt.subplot(223)

plt.scatter(x, values)

plt.subplot(1,2,2)

plt.plot(x, values)

plt.suptitle('subplot')

plt.show()
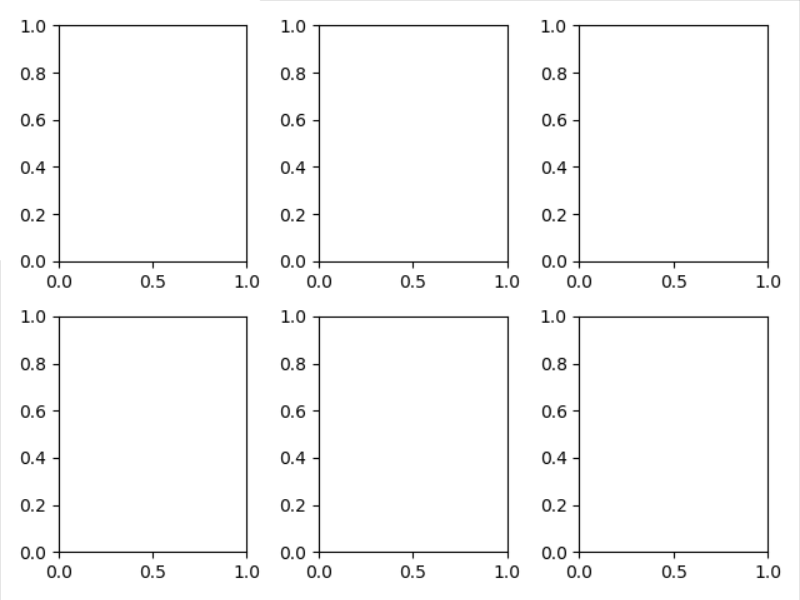
2、subplots布局
matplotlib.pyplot.subplots(nrows=1, ncols=1, sharex=False, sharey=False, squeeze=True, subplot_kw=None, gridspec_kw=None, **fig_kw) :创建一个图形和一组子图。
fig, ax = plt.subplots(2, 3)

fig.tight_layout()

ax[0].text(0.5,0.5, 'sss')

plt.show()
3、subplot2grid布局
matplotlib.pyplot.subplot2grid(shape, loc, rowspan=1, colspan=1, fig=None, **kwargs)
shape : sequence of 2 ints
loc : sequence of 2 ints
rowspan : int
Number of rows for the axis to span to the right.
colspan : int
Number of columns for the axis to span downwards.
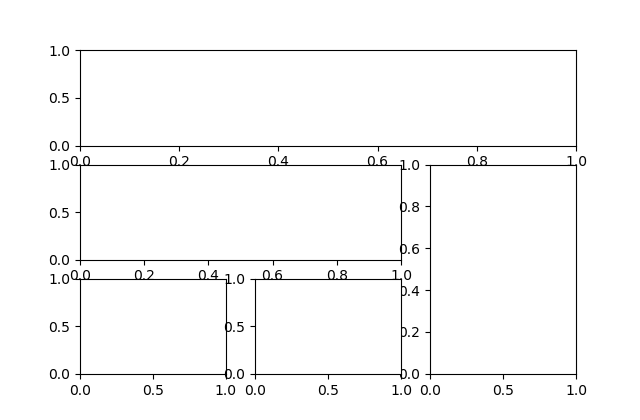
fig = plt.figure()

ax1 = plt.subplot2grid((3, 3), (0, 0), colspan=3)

ax2 = plt.subplot2grid((3, 3), (1, 0), colspan=2)

ax3 = plt.subplot2grid((3, 3), (1, 2), rowspan=2)

ax4 = plt.subplot2grid((3, 3), (2, 0))

ax5 = plt.subplot2grid((3, 3), (2, 1))

plt.show()
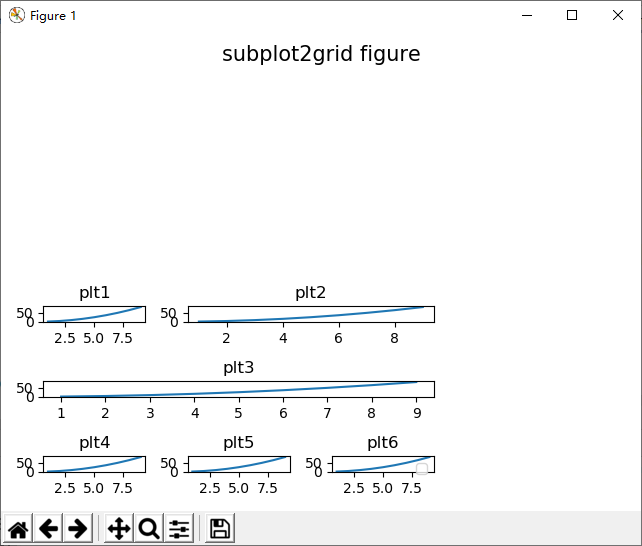
x = np.arange(1,10)

fig = plt.figure()

ax1 = plt.subplot2grid((3, 3), (0, 0), colspan=1, title = 'plt1')

ax1.plot(x,x*x)

ax2 = plt.subplot2grid((3, 3), (0, 1), colspan=2, title = 'plt2')

ax2.plot(x,x*x)

ax3 = plt.subplot2grid((3, 3), (1, 0), colspan=3, title = 'plt3')

ax3.plot(x,x*x)

ax4 = plt.subplot2grid((3, 3), (2, 0), title = 'plt4')

ax4.plot(x,x*x)

ax5 = plt.subplot2grid((3, 3), (2, 1), title = 'plt5')

ax5.plot(x,x*x)

ax6 = plt.subplot2grid((3, 3), (2, 2), title = 'plt6')

ax6.plot(x,x*x)

plt.legend()

plt.suptitle('subplot2grid figure',  x=0.5,y=0.95, ha='center', va='center', fontsize=15)

plt.show()
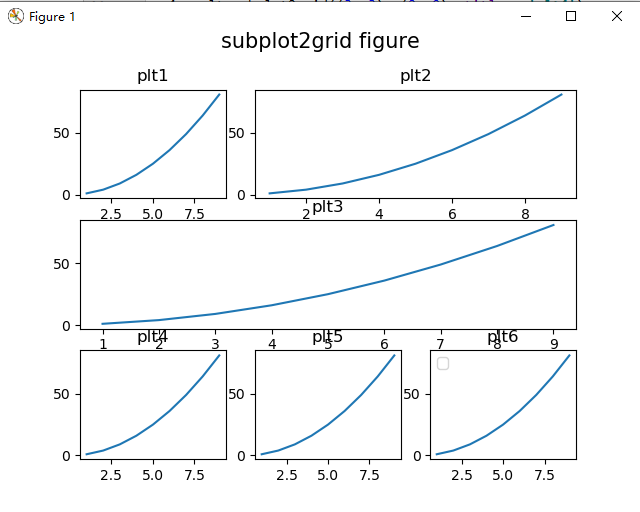
可见上面的图,x周名称和附件的图互相干涉。需要缩小图或者加大间隙。
使用layout函数plt.tight_layout()。但是图的title和第一行干涉。
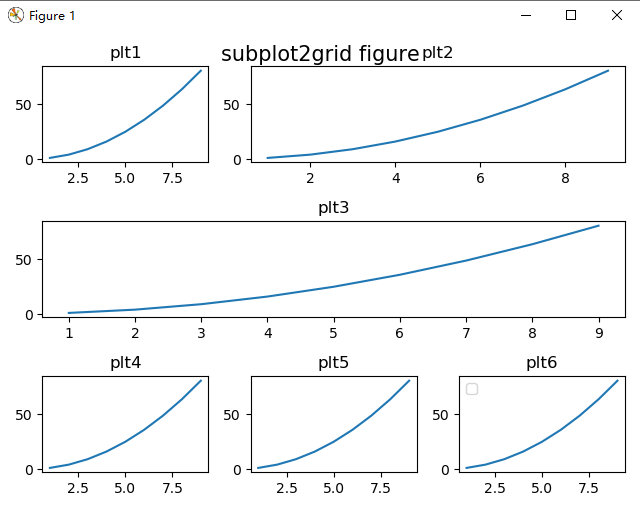
plt.tight_layout(rect=[0, 0, 1, 0.95]) 或者添加一句fig.subplots_adjust(top=0.85)即可。
matplotlib.pyplot.tight_layout(pad=1.08, h_pad=None, w_pad=None, rect=None)
其中rect可以这样定义:[left, bottom, right, top] in normalized (0, 1) figure coordinates,所以可以定义right和top,进行图的缩放。
A rectangle (left, bottom, right, top) in the normalized figure coordinate that the whole subplots area (including labels) will fit into. Default is (0, 0, 1, 1).
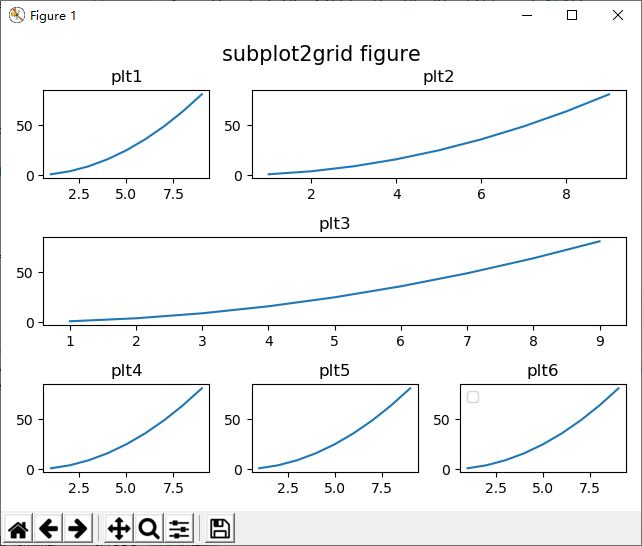
图的缩放,做个实验plt.tight_layout(rect=[0, 0, 0.7, 0.5])
matplotlib画图总结--多子图布局的更多相关文章
- matplotlib 画图
matplotlib 画图 1. 画曲线图 Tompson = np.array([0, 0, 0, 0, 0.011, 0.051, 0.15, 0.251, 0.35, 0.44, 0 ...
- matplotlib画图实例:pyplot、pylab模块及作图參数
http://blog.csdn.net/pipisorry/article/details/40005163 Matplotlib.pyplot画图实例 {使用pyplot模块} matplotli ...
- matplotlib画图报错This figure includes Axes that are not compatible with tight_layout, so results might be incorrect.
之前用以下代码将实验结果用matplotlib show出来 plt.plot(np.arange(len(aver_reward_list)), aver_reward_list) plt.ylab ...
- python matplotlib画图产生的Type 3 fonts字体没有嵌入问题
ScholarOne's 对python matplotlib画图产生的Type 3 fonts字体不兼容,更改措施: 在程序中添加如下语句 import matplotlib matplotlib. ...
- 使用python中的matplotlib 画图,show后关闭窗口,继续运行命令
使用python中的matplotlib 画图,show后关闭窗口,继续运行命令 在用python中的matplotlib 画图时,show()函数总是要放在最后,且它阻止命令继续往下运行,直到1.0 ...
- matplotlib画图
matplotlib画图 import numpy as np import matplotlib.pyplot as plt x1=[20,33,51,79,101,121,132,145,162, ...
- python3 使用matplotlib画图出现中文乱码的情况
python3使用matplotlib画图,因python3默认使用中unicode编码,所以在写代码时不再需要写 plt.xlabel(u’人数’),而是直接写plt.xlabel(‘人数’). 注 ...
- python使用matplotlib画图
python使用matplotlib画图 matplotlib库是python最著名的画图库.它提供了一整套和matlab类似的命令API.十分适合交互式地进行制图. 先介绍了怎样使用matplotl ...
- matplotlib画图出现乱码情况
python3使用matplotlib画图,因python3默认使用中unicode编码,所以在写代码时不再需要写 plt.xlabel(u’人数’),而是直接写plt.xlabel(‘人数’). 注 ...
随机推荐
- MySQL Index 索引提示:force or use
一.使用索引提示(Index Hint)的条件 1.Mysql优化器错误的选择了某个索引.这种情况很少发生,需要做数据库的表.索引的统计分析. 2.某个SQL语句可选择的索引非常多,这个时候优化器执行 ...
- .net常用属性
1. 在ASP.NET中专用属性: 获取服务器电脑名:Page.Server.ManchineName 获取用户信息:Page.User ...
- CF788B Weird journey 欧拉路径+计数
给定一张 $n$ 个点 $m$ 条无向边的图(无重边) :定义一种行走方案为:$m-2$ 条边走 $2$ 次,其余 $2$ 条边只走一次. 两个行走方案不同,当且仅当走一次的两条边中有不同的. 一条边 ...
- javascript监听浏览器前进后退
window.addEventListener("popstate", function () { backStatus=true; return; })
- Foundation-常用结构体
复习 void test(){ struct Date{ int year; int month; int day; }; struct Date d={2015,5,14}; d.day=6; } ...
- c++ 判断是元音还是辅音
#include <iostream> using namespace std; int main() { char c; int isLowercaseVowel, isUppercas ...
- 三十、CentOS 7之systemd
一.系统启动流程 POST --> bootloader --> MBR工作 --> kernel(initramfs/initrd) --> ro rootfs --> ...
- 使用axios请求的坑
配置axios在vue-cli中的使用: 在main.js中配置 import axios from "axios" Vue.config.productionTip = fals ...
- tecplot 把散点绘成曲面图【转载】
转载自:http://blog.sina.com.cn/s/blog_a319f5ff0101q6s8.html 找了好久,终于自己研究出来,如何使用tecplot绘制曲面图了 第一步:数据的整理 如 ...
- Linux设备驱动 之 中断处理程序
注册中断处理程序 中断处理程序是管理硬件驱动程序的组成部分:如果设备使用中断,那么相应的驱动程序就注册一个中断处理程序: 驱动程序通过request_irq()函数注册,并且激活给定的中断线,以处理中 ...