[转帖]使用Grafana和Telegraf监视VMware ESXi的方法
使用Grafana和Telegraf监视VMware ESXi的方法
https://ywnz.com/linuxyffq/4660.html

坐着很牛B  我比较傻逼.. 照葫芦画瓢之
|
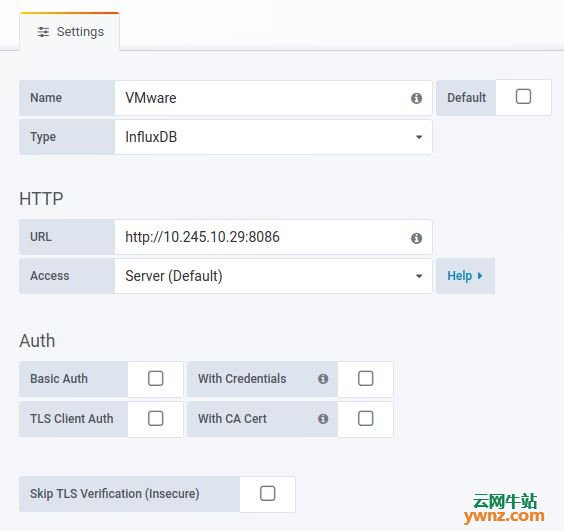
本文介绍使用Grafana和Telegraf监视VMware ESXi的方法,设置非常简单,使用Telegraf的官方vSphere插件从vCenter中提取指标,这包括在vSphere虚拟机管理程序上运行的vSphere主机计算(RAM和CPU),网络,数据存储和虚拟机的度量标准。 一、安装InfluxDB和Grafana参考文章 所有收集的指标都存储在InfluxDB数据库中,Grafana将连接到InfluxDB,以在其仪表板上查询和显示指标。参考以下文章: 在Ubuntu 18.04/Debian 9系统上安装InfluxDB的方法。 在RHEL 8/CentOS 8上安装InfluxDB的方法。 在Ubuntu 18.04系统中安装Grafana 6的方法。 一旦安装了InfluxDB和Grafana,继续安装和配置Telegraf。 二、安装和配置Telegraf 如果你使用步骤一中的链接来安装InfluxDB,则会添加Telegraf安装所需的存储库,只需使用以下命令安装Telegraf即可。 CentOS系统运行: sudo yum -y install telegraf Ubuntu系统运行: sudo apt-get -y install telegraf 安装后,我们需要配置Telegraf以从vCenter中提取监控指标,编辑Telegraf主配置文件: sudo vim /etc/telegraf/telegraf.conf 1、添加InfluxDB输出存储后端,以存储指标: # Configuration for sending metrics to InfluxDB [[outputs.influxdb]] urls = ["http://10.10.1.20:8086"] database = "vmware" timeout = "0s" username = "monitoring" password = "DBPassword" 将10.10.1.20替换为InfluxDB服务器IP地址,如果你没有在InfluxDB上启用身份验证,则可以安全地删除配置中的用户名和密码行。 2、为Telegraf配置vsphere输入插件,完整配置应该类似以下内容: # Read metrics from VMware vCenter [[inputs.vsphere]] ## List of vCenter URLs to be monitored. These three lines must be uncommented ## and edited for the plugin to work. vcenters = [ "https://10.10.1.2/sdk" ] username = "administrator@vsphere.local" password = "AdminPassword" # ## VMs ## Typical VM metrics (if omitted or empty, all metrics are collected) vm_metric_include = [ "cpu.demand.average", "cpu.idle.summation", "cpu.latency.average", "cpu.readiness.average", "cpu.ready.summation", "cpu.run.summation", "cpu.usagemhz.average", "cpu.used.summation", "cpu.wait.summation", "mem.active.average", "mem.granted.average", "mem.latency.average", "mem.swapin.average", "mem.swapinRate.average", "mem.swapout.average", "mem.swapoutRate.average", "mem.usage.average", "mem.vmmemctl.average", "net.bytesRx.average", "net.bytesTx.average", "net.droppedRx.summation", "net.droppedTx.summation", "net.usage.average", "power.power.average", "virtualDisk.numberReadAveraged.average", "virtualDisk.numberWriteAveraged.average", "virtualDisk.read.average", "virtualDisk.readOIO.latest", "virtualDisk.throughput.usage.average", "virtualDisk.totalReadLatency.average", "virtualDisk.totalWriteLatency.average", "virtualDisk.write.average", "virtualDisk.writeOIO.latest", "sys.uptime.latest", ] # vm_metric_exclude = [] ## Nothing is excluded by default # vm_instances = true ## true by default # ## Hosts ## Typical host metrics (if omitted or empty, all metrics are collected) host_metric_include = [ "cpu.coreUtilization.average", "cpu.costop.summation", "cpu.demand.average", "cpu.idle.summation", "cpu.latency.average", "cpu.readiness.average", "cpu.ready.summation", "cpu.swapwait.summation", "cpu.usage.average", "cpu.usagemhz.average", "cpu.used.summation", "cpu.utilization.average", "cpu.wait.summation", "disk.deviceReadLatency.average", "disk.deviceWriteLatency.average", "disk.kernelReadLatency.average", "disk.kernelWriteLatency.average", "disk.numberReadAveraged.average", "disk.numberWriteAveraged.average", "disk.read.average", "disk.totalReadLatency.average", "disk.totalWriteLatency.average", "disk.write.average", "mem.active.average", "mem.latency.average", "mem.state.latest", "mem.swapin.average", "mem.swapinRate.average", "mem.swapout.average", "mem.swapoutRate.average", "mem.totalCapacity.average", "mem.usage.average", "mem.vmmemctl.average", "net.bytesRx.average", "net.bytesTx.average", "net.droppedRx.summation", "net.droppedTx.summation", "net.errorsRx.summation", "net.errorsTx.summation", "net.usage.average", "power.power.average", "storageAdapter.numberReadAveraged.average", "storageAdapter.numberWriteAveraged.average", "storageAdapter.read.average", "storageAdapter.write.average", "sys.uptime.latest", ] # host_metric_exclude = [] ## Nothing excluded by default # host_instances = true ## true by default # ## Clusters cluster_metric_include = [] ## if omitted or empty, all metrics are collected # cluster_metric_exclude = [] ## Nothing excluded by default # cluster_instances = false ## false by default # ## Datastores datastore_metric_include = [] ## if omitted or empty, all metrics are collected # datastore_metric_exclude = [] ## Nothing excluded by default # datastore_instances = false ## false by default for Datastores only # ## Datacenters datacenter_metric_include = [] ## if omitted or empty, all metrics are collected datacenter_metric_exclude = [ "*" ] ## Datacenters are not collected by default. # datacenter_instances = false ## false by default for Datastores only # ## Plugin Settings ## separator character to use for measurement and field names (default: "_") # separator = "_" # ## number of objects to retreive per query for realtime resources (vms and hosts) ## set to 64 for vCenter 5.5 and 6.0 (default: 256) # max_query_objects = 256 # ## number of metrics to retreive per query for non-realtime resources (clusters and datastores) ## set to 64 for vCenter 5.5 and 6.0 (default: 256) # max_query_metrics = 256 # ## number of go routines to use for collection and discovery of objects and metrics # collect_concurrency = 1 # discover_concurrency = 1 # ## whether or not to force discovery of new objects on initial gather call before collecting metrics ## when true for large environments this may cause errors for time elapsed while collecting metrics ## when false (default) the first collection cycle may result in no or limited metrics while objects are discovered # force_discover_on_init = false # ## the interval before (re)discovering objects subject to metrics collection (default: 300s) # object_discovery_interval = "300s" # ## timeout applies to any of the api request made to vcenter # timeout = "60s" # ## Optional SSL Config # ssl_ca = "/path/to/cafile" # ssl_cert = "/path/to/certfile" # ssl_key = "/path/to/keyfile" ## Use SSL but skip chain & host verification insecure_skip_verify = true 要改变的变量是: 1]、10.10.1.2应替换为vCenter IP地址。 2]、administrator@vsphere.local应与你的vCenter用户帐户匹配。 3]、带有密码的AdminPassword用于进行身份验证。 如果vCenter Server具有自签名证书,请确保将insecure_skip_verify标志设置为true: insecure_skip_verify = true 进行更改后启动并启用Telegraf服务: sudo systemctl restart telegraf sudo systemctl enable telegraf 三、检查InfluxDB指标 我们需要确认我们的指标被推送到InfluxDB并且可以看到它们。 1、打开InfluxDB shell 使用身份验证: $ influx -username 'username' -password 'StrongPassword' Connected to http://localhost:8086 version 1.6.4 InfluxDB shell version: 1.6.4 1]、 'username' - InfluxDB身份验证用户名。 2]、'StrongPassword' - InfluxDB密码。 没有认证: $ influx Connected to http://localhost:8086 version 1.6.4 InfluxDB shell version: 1.6.4 切换到我们在telegraf上配置的vmware数据库: > USE vmware Using database vmware 检查时间序列指标是否inflow: > SHOW MEASUREMENTS name: measurements name ---- cpu disk diskio kernel mem processes swap system vsphere_cluster_clusterServices vsphere_cluster_mem vsphere_cluster_vmop vsphere_datacenter_vmop vsphere_datastore_datastore vsphere_datastore_disk vsphere_host_cpu vsphere_host_disk vsphere_host_mem vsphere_host_net vsphere_host_power vsphere_host_storageAdapter vsphere_host_sys vsphere_vm_cpu vsphere_vm_mem vsphere_vm_net vsphere_vm_power vsphere_vm_sys vsphere_vm_virtualDisk > 四、将InfluxDB数据源添加到Grafana 登录Grafana并添加InfluxDB数据源,指定服务器IP、数据库名称和身份验证帐户:
给它命名,选择类型,指定服务器IP:
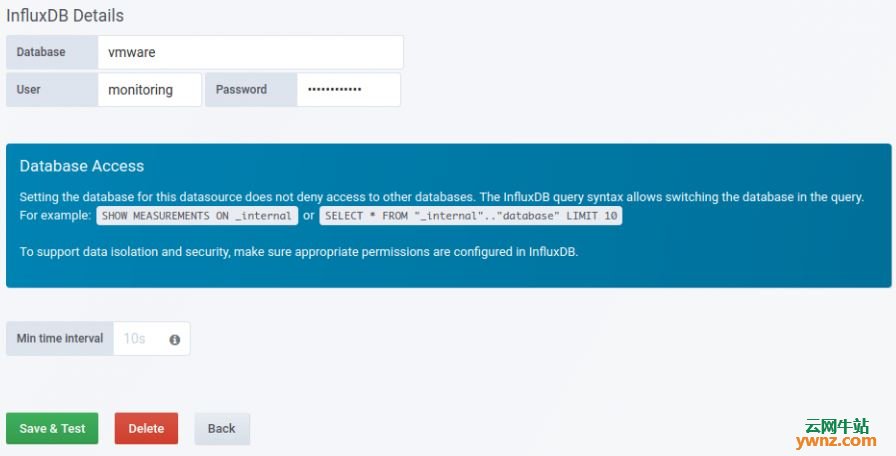
提供数据库名称和身份验证帐户:
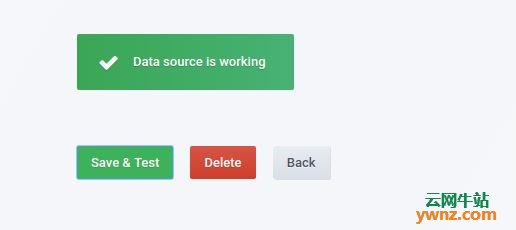
保存并测试设置:
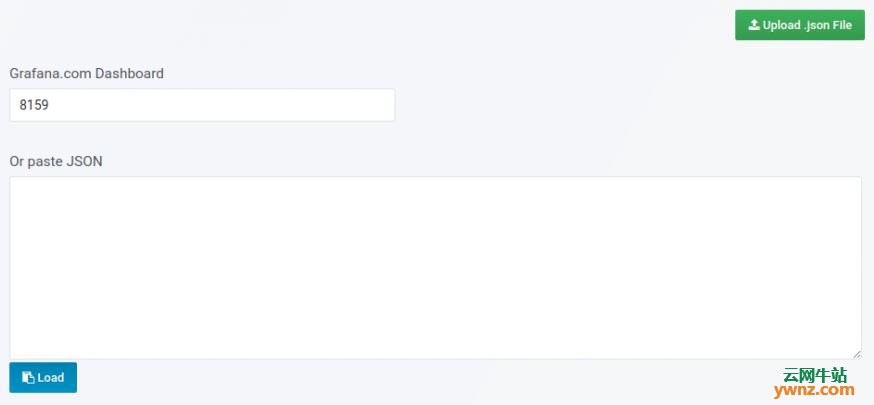
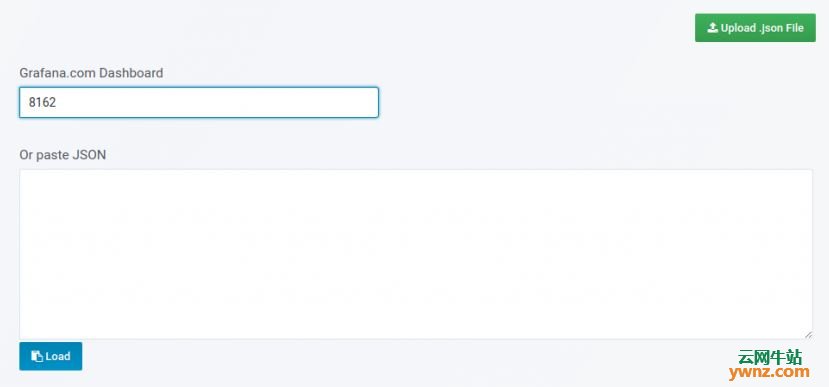
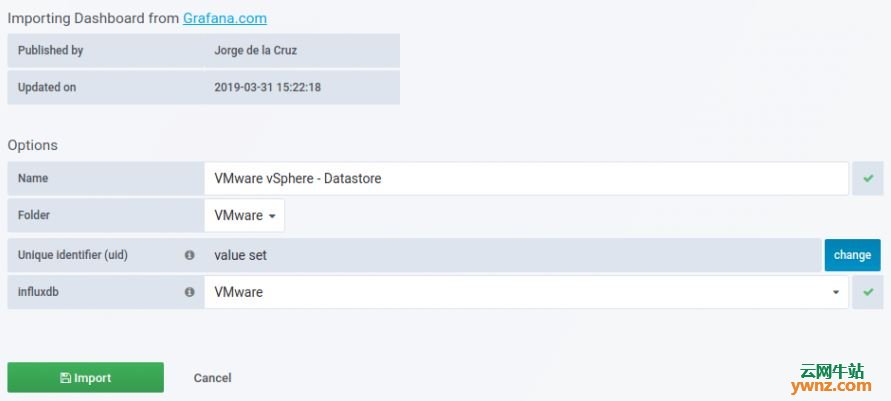
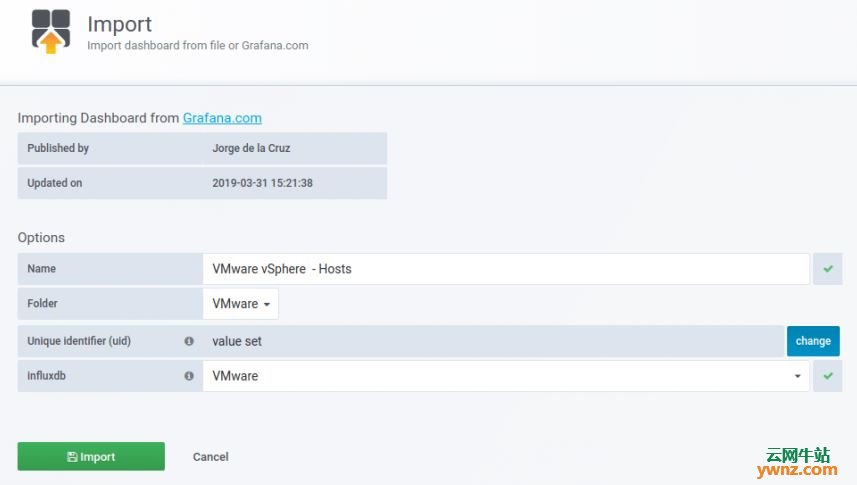
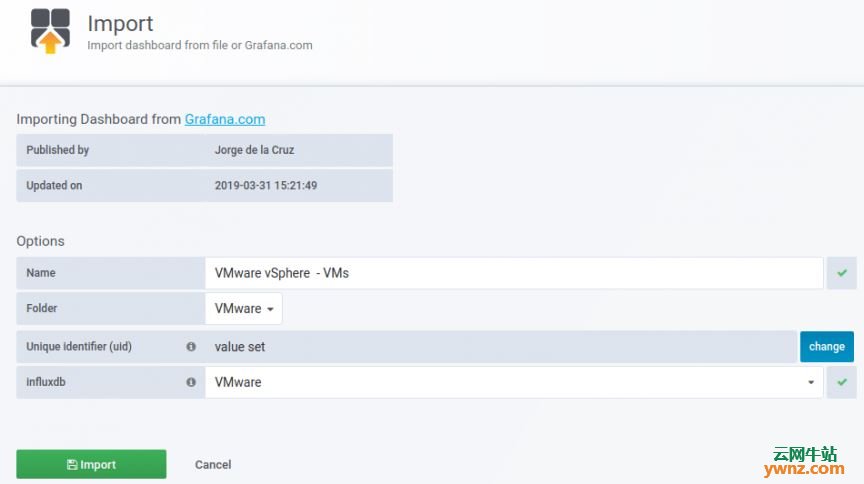
五、导入Grafana仪表板 我们已将所有依赖项和测试配置好,最后一项操作是创建或导入将显示vSphere指标的Grafana仪表板。 登录你的Grafana并导航到Dashboard导入部分,使用仪表板ID导入,链接如下: https://grafana.com/dashboards/8159 https://grafana.com/dashboards/8162 https://grafana.com/dashboards/8165 https://grafana.com/dashboards/8168 操作截图如下:
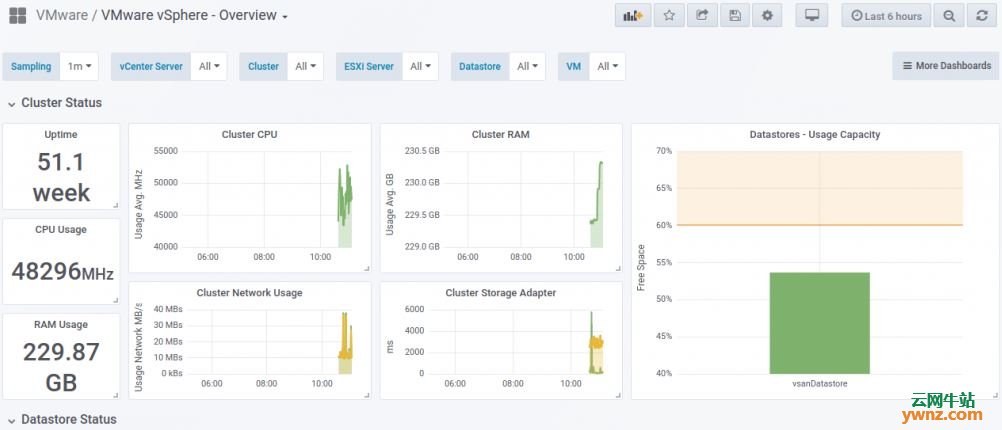
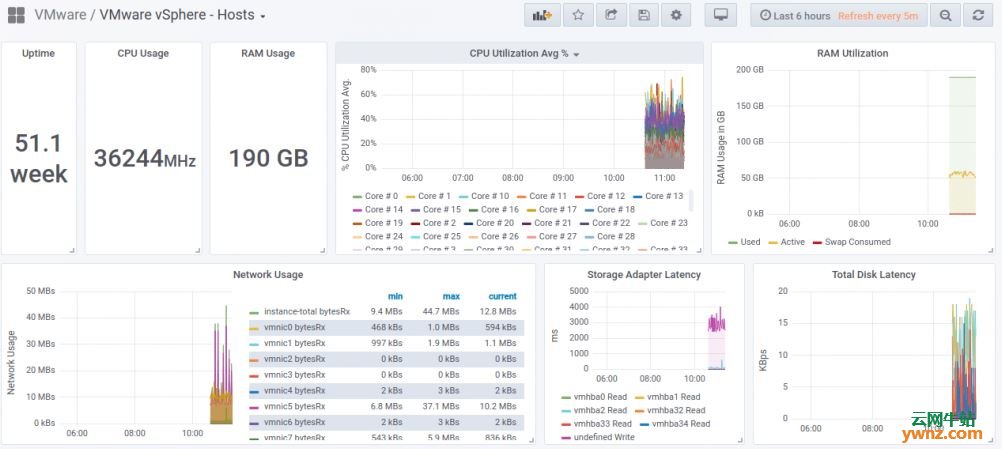
成功导入后,应该能看到仪表板上显示的数据了,如下图所示:
看到如上图,表明导入Grafana全部成功了。 相关主题 |

[转帖]使用Grafana和Telegraf监视VMware ESXi的方法的更多相关文章
- grafana + influxdb + telegraf
grafana + influxdb + telegraf , 构建性能监控平台http://www.cnblogs.com/Scissors/p/5977670.html https://docs. ...
- Grafana+Influxdb+Telegraf监控mysql
Grafana+Influxdb+Telegraf监控mysql 一.安装 1.1安装Grafana+influxdb+telegraf 1.2启动服务,添加开机启动 1.3查看grafana界面 二 ...
- vmware esxi 找不到网卡驱动,硬盘的解决方法
解决方法就是把ESXi无法识别的硬件的驱动定制进安装镜像文件中. ESXi 5.5 U2: VMware-VMvisor-Installer-5.5.0.update02-2068190.x86_64 ...
- RHEL 6.5 PXE 安装调试 VMWARE ESXi 5.1 安装
测试环境:win10/vmware workstation 12 pro 操作系统:RHEL 6.5(PXE服务器) [2016.11.30] [遗留问题] 1.ks.cfg通过本地文件方式加载不成功 ...
- Hyper-V架构与VMware ESXi的差异
微软的Hyper-V与VMware的ESXi在架构上有众多不同,然而很多虚拟化管理员并未意识到这些差异.而且很多管理员同样对Hyper-V是在主机操作系统上运行感到困惑. 有关微软Hyper-V的一个 ...
- VMware ESXi客户端连接控制台时提示"VMRC控制台连接已断开...正在尝试重新连接"的解决方法
通过vSphere Client连接到安装VMware ESXi虚拟环境的主机时,当启动操作系统,选中控制台时控制台上方提示一行"VMRC控制台的连接已断开...正在尝试重新连接" ...
- 物理主机win 7系统迁移至VMware ESXI服务器
一.实验环境如下图所示: 二.实验要求(如上图所示) 通过 计算机B (IP:10.8.9.18) 将 计算机A (IP:10.8.9.155) 迁移到 服务器(IP:10.8.9.161) 三.实 ...
- [转载]在Vmware ESXI中安装群晖Synology DSM 5.0 (4528)
转载 在Vmware ESXI中安装群晖Synology DSM 5.0 (4528) 文件准备 Vmware ESXi用户安装需要的文件 NB_x64_5032_DSM_50-4528_Xpenol ...
- VMware ESXi 5.5创建虚拟机
1.用鼠标右键单击连接到的IP地址,在弹出的快捷菜单中选择“新建虚拟机”选项,或者按“Ctrl+N”热键. 2.选择自定义 3.自定义服务器名称,并且名称最好是英文而且名称需要是唯一的. 4.选择本地 ...
随机推荐
- 【集训队作业2018】count
CSP后第一发Blog. 这道题没有一下子过掉,开始还推出了错的结论.在错误的生成函数里绕了好久-- 很显然的转笛卡尔树,一个笛卡尔树对应一种序列.只要考虑一个笛卡尔树是否合法. 贪心地填数发现,从根 ...
- Postman集合/文件夹/请求中脚本的执行顺序
Postman的Collection(集合)/Folder(集合的子文件夹)/Request(请求)中都有Pre-request Script(请求前脚本)和Tests(请求后脚本) 这个功能类似于不 ...
- 【MAC工具】手机抓包工具之 —— whistle
本文链接:https://blog.csdn.net/weixin_42534940/article/details/88783455安装参考: https://github.com/avwo/whi ...
- 安装mongodb-window10版
第一.下载mongodb 官方地址:https://www.mongodb.com/ 第二步mongodb安装 运行mongodb-win32-x86_64-2008plus-ssl-v3.4-lat ...
- IDEA如何切换到括号外
一般我们输入完括号后都会习惯性Enter或者Shift + Enter切换到括号外,结果却变成了: public void nothing() Enter → public void nothing( ...
- 设置Fedora能够使用root用户登录
1. 切换到root工作环境,因为一下操作必须拥有root权限 [ha@localhost ~]$ su root密码: 2. 编辑/etc/pam.d/gdm [root@localhost ha] ...
- 编译原理 DFA(确定性有穷自动机)&& NFA(非确定性有穷自动机)
https://www.cnblogs.com/fpcbk/p/11004913.html
- 多目标优化算法(一)NSGA-Ⅱ(NSGA2)(转载)
多目标优化算法(一)NSGA-Ⅱ(NSGA2) 本文链接:https://blog.csdn.net/qq_40434430/article/details/82876572多目标优化算法(一)NSG ...
- MySQL主从双向同步
最近部署测试环境,涉及到MySQL数据库主从双向同步的部署,记录一下部署过程,正常读写都发生在主库,从库作为备选数据库(热备份),当主库发生异常,数据库自动切换到从库,这里面是怎么监控数据库异常并触发 ...
- Linux终端中文显示乱码
今天,帮我们同学处理一下中文显示乱码的问题.这个是个国内Linux用户烦恼的问题,由于大部分的Linux发行版都是以英语为主体的,而且英文在通用性和稳定性上都比中文要好一些,各种奇怪的BUG也要少一点 ...