k8s之自定义指标API部署prometheus
1.自定义指标-prometheus
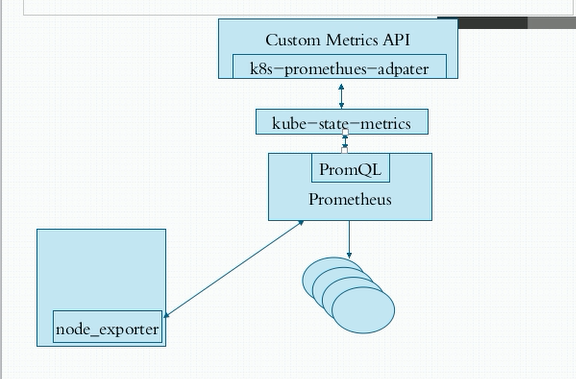
node_exporter是agent;PromQL相当于sql语句来查询数据;
k8s-prometheus-adapter:prometheus是不能直接解析k8s的指标的,需要借助k8s-prometheus-adapter转换成api;
kube-state-metrics是用来整合数据的.
访问:https://github.com/kubernetes/kubernetes/tree/master/cluster/addons/prometheus
git clone https://github.com/iKubernetes/k8s-prom.git
cd k8s-prom && kubectl apply -f namespace.yaml
# 部署node_exporter
cd node_exporter/ && kubectl apply -f .
# 部署prometheus,注释掉资源限制limit,
cd prometheus/ && vim prometheus-deploy.yaml && kubectl apply -f .
#resources:
# limits:
# memory: 200Mi
这个pod没有部署好,prometheus就无法收集到数据,导致grafana界面没有数据,浪费了一天时间
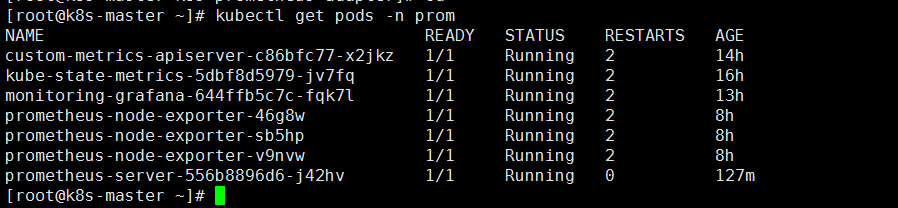
kubectl get pods -n prom
prometheus-server-64877844d4-gx4jr 1/1 Running 0 <invalid>
访问NodePort,访问prometheus

部署k8s-prometheus-adapter,需要自制证书
cd kube-state-metrics/ && kubectl apply -f .
cd /etc/kubernetes/pki/
(umask 077; openssl genrsa -out serving.key 2048)
openssl req -new -key serving.key -out serving.csr -subj "/CN=serving"
openssl x509 -req -in serving.csr -CA ./ca.crt -CAkey ./ca.key -CAcreateserial -out serving.crt -days 3650
# custom-metrics-apiserver-deployment.yaml会用到secretName: cm-adapter-serving-certs
kubectl create secret generic cm-adapter-serving-certs --from-file=serving.crt=./serving.crt --from-file=serving.key=./serving.key -n prom # 部署k8s-prometheus-adapter,由于版本问题,需要下载两个文件,将两个文件中的名称空间改为prom
cd k8s-prometheus-adapter/
mv custom-metrics-apiserver-deployment.yaml ..
wget https://raw.githubusercontent.com/DirectXMan12/k8s-prometheus-adapter/master/deploy/manifests/custom-metrics-apiserver-deployment.yam
wget https://raw.githubusercontent.com/DirectXMan12/k8s-prometheus-adapter/master/deploy/manifests/custom-metrics-config-map.yaml
kubectl apply -f . kubectl api-versions # 必须出现这个api,并且开启代理可以访问到数据
custom.metrics.k8s.io/v1beta1
kubectl proxy --port=8080
curl http://localhost:8080/apis/custom.metrics.k8s.io/v1beta1/
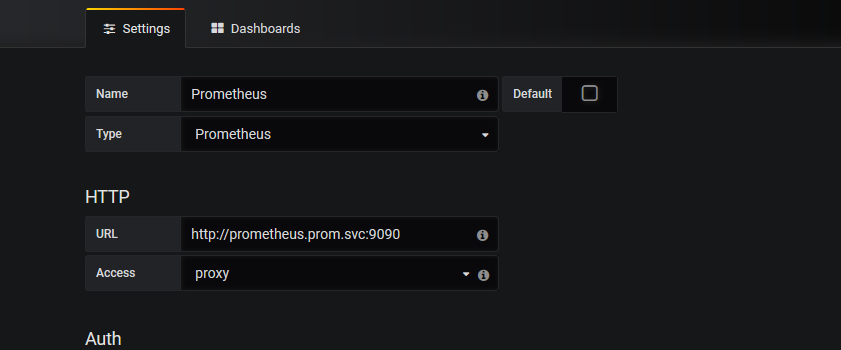
# prometheus和grafana整合
wget https://raw.githubusercontent.com/kubernetes-retired/heapster/master/deploy/kube-config/influxdb/grafana.yaml
把namespace: kube-system改成prom,有两处;
把env里面的下面两个注释掉:
- name: INFLUXDB_HOST
value: monitoring-influxdb
在最有一行加个type: NodePort
ports:
- port: 80
targetPort: 3000
selector:
k8s-app: grafana
type: NodePort
kubectl apply -f grafana.yaml
kubectl get svc -n prom
monitoring-grafana NodePort 10.96.228.0 <none> 80:30336/TCP 13h
prom名称空间内的所有pod
访问:10.0.0.20:30336
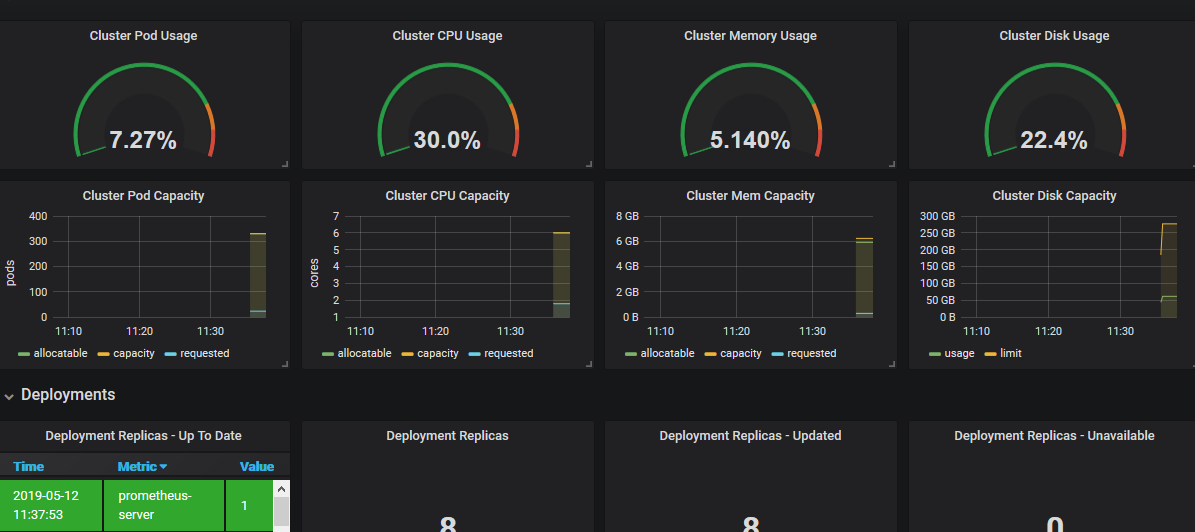
两个k8s模板:https://grafana.com/dashboards/6417 https://grafana.com/dashboards/315

一切顺利的话,立马就能看到监控数据
2.HPA(水平pod自动扩展)
当pod压力大了,会根据负载自动扩展Pod个数以缓解压力
kubectl api-versions |grep auto

创建一个带有资源限制的pod

kubectl run myapp --image=ikubernetes/myapp:v1 --replicas=1 \

--requests='cpu=50m,memory=256Mi' --limits='cpu=50m,memory=256Mi' \

--labels='app=myapp' --expose --port=80

# 让myapp这个控制器支持自动扩展,--cpu-percent表示cpu超过这个值就开始扩展

kubectl autoscale deployment myapp --min=1 --max=5 --cpu-percent=60

kubectl get hpa

# 对pod进行压力测试

kubectl patch svc myapp -p '{"spec":{"type": "NodePort"}}'

yum install httpd-tools

# 随着cpu压力的上升,会看到自动扩展为4个或更多的pod

ab -c 1000 -n 5000000 http://172.16.1.100:31990/index.html

# hpa v1版本只能根据cpu利用率扩展pod,hpa v2可以根据自定义指标利用率水平扩展pod

kubectl delete hpa myapp

cat hpa-v2-demo.yaml

apiVersion: autoscaling/v2beta1

kind: HorizontalPodAutoscaler

metadata:

  name: myapp-hpa-v2

spec:

  scaleTargetRef: # 根据什么指标来做评估压力

    apiVersion: apps/v1

    kind: Deployment

    name: myapp  # 对哪个控制器做自动扩展

  minReplicas: 1

  maxReplicas: 10

  metrics: # 依据哪些指标来进行评估

  - type: Resource # 基于资源进行评估

    resource:

      name: cpu

      targetAverageUtilization: 55 # cpu使用率超过55%,就自动水平扩展pod个数

  - type: Resource

    resource:

      name: memory  # v2版可以根据内存进行评估

      targetAverageValue: 50Mi # 内存使用超过50M,就自动水平扩展pod个数

kubectl apply -f hpa-v2-demo.yaml

# 进行压测即可看到pod会自动扩展

# 自定义的资源指标,pod被开发好之后,得支持这些指标,否则就是白写

# 下面这个例子中支持并发参数的镜像地址:https://hub.docker.com/r/ikubernetes/metrics-app/

cat hpa-v2-custom.yaml

apiVersion: autoscaling/v2beta1

kind: HorizontalPodAutoscaler

metadata:

  name: myapp-hpa-v2

spec:

  scaleTargetRef:

    apiVersion: apps/v1

    kind: Deployment

    name: myapp

  minReplicas: 1

  maxReplicas: 10

  metrics:

  - type: Pods  # 利用pod中定义的指标进行扩缩

    pods:

      metricName: http_requests  # 自定义的资源指标

        targetAverageValue: 800m # m表示个数,并发数800
参考博客:http://blog.itpub.net/28916011/viewspace-2216340/
prometheus监控mysql、k8s:https://www.cnblogs.com/sfnz/p/6566951.html
k8s之自定义指标API部署prometheus的更多相关文章
- k8s之资源指标API部署metrics-server
1.部署metrics-server 从v1.8开始,引入了新的功能,即把资源指标引入api,资源指标:metrics-server,自定义指标:prometheus,k8s-prometheus-a ...
- 十七,k8s集群指标API及自定义API
目录 资源指标: Metrics-Server 资源指标: Metric-Server介绍 Metric-Server部署 下载yaml文件 因为有墙, 所以提前下载image镜像, 当然也可以手动修 ...
- Kubernetes 学习23 kubernetes资源指标API及自定义指标API
一.概述 1.上集中我们说到,官方文档提示说从k8s 1.11版本开始,将监控体系指标数据获取机制移向新一代的监控模型.也就意味着对于我们的k8s来讲现在应该有这样两种资源指标被使用.一种是资源指标, ...
- k8s系列---资源指标API及自定义指标API
不得不说千万不要随意更改版本,我用的1.13的版本,然后学到这一步时,还因yaml文件不同,卡住了很久,然后各种google才找到解决办法 https://www.linuxea.com/2112. ...
- kubernetes学习笔记之十二:资源指标API及自定义指标API
第一章.前言 以前是用heapster来收集资源指标才能看,现在heapster要废弃了从1.8以后引入了资源api指标监视 资源指标:metrics-server(核心指标) 自定义指标:prome ...
- k8s-资源指标API及自定义指标API-二十三
一. 原先版本是用heapster来收集资源指标才能看,但是现在heapster要废弃了. 从k8s v1.8开始后,引入了新的功能,即把资源指标引入api: 在使用heapster时,获取资源指标是 ...
- 简单4步,利用Prometheus Operator实现自定义指标监控
本文来自Rancher Labs 在过去的文章中,我们花了相当大的篇幅来聊关于监控的话题.这是因为当你正在管理Kubernetes集群时,一切都会以极快的速度发生变化.因此有一个工具来监控集群的健康状 ...
- K8S(13)监控实战-部署prometheus
k8s监控实战-部署prometheus 目录 k8s监控实战-部署prometheus 1 prometheus前言相关 1.1 Prometheus的特点 1.2 基本原理 1.2.1 原理说明 ...
- Kubernetes 监控:Prometheus Adpater =》自定义指标扩缩容
使用 Kubernetes 进行容器编排的主要优点之一是,它可以非常轻松地对我们的应用程序进行水平扩展.Pod 水平自动缩放(HPA)可以根据 CPU 和内存使用量来扩展应用,前面讲解的 HPA 章节 ...
随机推荐
- CF1197A
CF1197A 题意: 定义k阶梯子为两边各一块木板长度至少k+1,中间k块木板至少为1 .问 给你n块木板,最多能搭成几阶的梯子. 解法: 读题两小时,代码五分钟. 考虑贪心,构成梯子的两侧的木棍一 ...
- POJ2689
题目 POJ2689 Prime Distance 原题传送门 主要思路 刚看到这题,心想:不就筛个 \(\left[2,U\right]\) 的质数表出来就可以了吗?一看数据范围: \(1<= ...
- 重读APUE(1)-lseek注意事项
lseek使用的注意事项: 1. lseek的返回值,成功返回新的文件偏移量,失败返回-1,不能用<0判断:因为文件偏移量可能是正的,也可能是负的,所以不能使用<0判断成功与否:注意:对于 ...
- Flutter移动电商实战 --(14)首页_拨打电话操作
拨打电话的功能在app里也很常见,比如一般的外卖app都会有这个才做.其实Flutter本身是没给我们提供拨打电话的能力的,那我们如何来拨打电话那? 1.编写店长电话模块 这个小伙伴们一定轻车熟路了, ...
- MySQL 创建和删除数据表
创建MySQL数据表需要以下信息: 表名 表字段名 定义每个表字段 语法 以下为创建MySQL数据表的SQL通用语法: CREATE TABLE table_name (column_name col ...
- 【原创】smarty引擎下的导航按钮高亮实现
<?php$_nvaarr = array( array('name'=>'首页','url'=>'company.php?id='), array('name'=>'公司介绍 ...
- linux 查看网络流量命令
转: linux 查看网络流量命令 2019年01月31日 14:22:00 weixin_33894992 阅读数 893 sar命令参数很多,有时间man一下. -n参数很有用,他有6个不同的 ...
- Java实现ModbusTCP通信
一个项目,需要用Java实现使用ModbusTCP和硬件设备通信 资料 代码下载 本文的代码和仿真软件:蓝奏云下载 官网资料 Modbus官网 Modbus协议 Modbus技术资源 MODBUS T ...
- Java操作excel_导出与读取(导入)
我自己的jar包下载 一.介绍 常常有客户这样子要求:你要把我们的报表直接用Excel打开(电信系统.银行系统).或者是:我们已经习惯用Excel打印.这样在我们实际的开发中,很多时候需要实现导入.导 ...
- js 匿名函数 js-函数定义方法
1.任何函数都是有返回值的,没有返回值的,在某些语言里称之为过程例如PL/SQL 2.js中的函数如果没有return 关键字指明给出的返回值,那么当调用完函数后,会返回“undefined" ...