prometheus从零开始
本次的想法是做服务监控 并告警 主要线路如下图所示

1、运行prometheus docker方式
- docker run -itd \
- -p 9090:9090 \
- -v /opt/prometheus/prometheus.yml:/etc/prometheus/prometheus.yml \
- prom/prometheus
2、prometheus.yml 初始配置文件如下:
- global:
- scrape_interval: 15s # By default, scrape targets every 15 seconds. 全局默认值 15秒抓取一次数据
- # Attach these labels to any time series or alerts when communicating with
- # external systems (federation, remote storage, Alertmanager).
- external_labels:
- monitor: 'codelab-monitor'
- # A scrape configuration containing exactly one endpoint to scrape:
- # Here it's Prometheus itself.
- scrape_configs:
- # The job name is added as a label `job=<job_name>` to any timeseries scraped from this config.
- - job_name: 'prometheus'
- # Override the global default and scrape targets from this job every 5 seconds.
- scrape_interval: 5s
- static_configs:
- - targets: ['localhost:9090']
3、默认 prometheus 会有自己的指标接口http://192.168.246.2:9090/metrics 内容部分截取如下
- # HELP go_gc_duration_seconds A summary of the pause duration of garbage collection cycles.
- # TYPE go_gc_duration_seconds summary
- go_gc_duration_seconds{quantile="0"} 2.6636e-05
- go_gc_duration_seconds{quantile="0.25"} 0.000123346
- go_gc_duration_seconds{quantile="0.5"} 0.000159706
- go_gc_duration_seconds{quantile="0.75"} 0.000190857
- go_gc_duration_seconds{quantile="1"} 0.001369042
4、可以登录9090端口去看看prometheus主界面 可以执行PromQL (Prometheus Query Language) 来excute得到结果
比如这个 prometheus_target_interval_length_seconds{quantile="0.99"}
具体PromQL语法示例请参考官网https://prometheus.io/docs/prometheus/latest/querying/basics/

5、上面的数据是prometheus自己的 ,下面我们自己生产数据给它 有很多公共的exporter 可以用 比如 node_exporter 他可以暴露机器一些基本的通用指标。
也可以执行python自定义编程 取指标 让自己成为一个exporter
安装node_exporter 官网例子 但是不要使用127.0.0.1 因为我的prometheus是docker起的 和宿主机的127.0.0.1是不通的 它抓取不到数据的,请改成实际的主机地址
ps:其他exporter 可参考地址 https://prometheus.io/docs/instrumenting/exporters/
- tar -xzvf node_exporter-*.*.tar.gz
- cd node_exporter-*.*
- # Start 3 example targets in separate terminals:
- ./node_exporter --web.listen-address 127.0.0.1:8080
- ./node_exporter --web.listen-address 127.0.0.1:8081
- ./node_exporter --web.listen-address 127.0.0.1:8082
6、需要修改prometheus.yml增加job 抓取exproter 修改后的如下 增加了 一个job 里面有三个exporter 标签是随便配的
- global:
- scrape_interval: 15s # By default, scrape targets every 15 seconds.
- # Attach these labels to any time series or alerts when communicating with
- # external systems (federation, remote storage, Alertmanager).
- external_labels:
- monitor: 'codelab-monitor'
- # A scrape configuration containing exactly one endpoint to scrape:
- # Here it's Prometheus itself.
- scrape_configs:
- # The job name is added as a label `job=<job_name>` to any timeseries scraped from this config.
- - job_name: 'prometheus'
- # Override the global default and scrape targets from this job every 5 seconds.
- scrape_interval: 5s
- static_configs:
- - targets: ['localhost:9090']
- - job_name: 'node'
- # Override the global default and scrape targets from this job every 5 seconds.
- scrape_interval: 5s
- static_configs:
- - targets: ['192.168.246.2:8080', '192.168.246.2:8081']
- labels:
- group: 'production'
- - targets: ['192.168.246.2:8082']
- labels:
- group: 'canary'
6、查看页面 是否ok了

7、可以看看node_exporter 暴露的指标例子 比如有如下的
- node_cpu_seconds_total{cpu="0",mode="idle"} 2963.27
- node_cpu_seconds_total{cpu="0",mode="iowait"} 0.38
- node_cpu_seconds_total{cpu="0",mode="irq"} 0
- node_cpu_seconds_total{cpu="0",mode="nice"} 0
- node_cpu_seconds_total{cpu="0",mode="softirq"} 0.35
- node_cpu_seconds_total{cpu="0",mode="steal"} 0
- node_cpu_seconds_total{cpu="0",mode="system"} 19.19
- node_cpu_seconds_total{cpu="0",mode="user"} 16.96
- node_cpu_seconds_total{cpu="1",mode="idle"} 2965.47
- node_cpu_seconds_total{cpu="1",mode="iowait"} 0.37
- node_cpu_seconds_total{cpu="1",mode="irq"} 0
- node_cpu_seconds_total{cpu="1",mode="nice"} 0.03
- node_cpu_seconds_total{cpu="1",mode="softirq"} 0.28
- node_cpu_seconds_total{cpu="1",mode="steal"} 0
- node_cpu_seconds_total{cpu="1",mode="system"} 18.42
- node_cpu_seconds_total{cpu="1",mode="user"} 17.95
8、如果我们想看 近5分钟内 每个实例的所有cpus的平均每秒CPU时间速率 可以这样写
- avg by (job, instance, mode) (rate(node_cpu_seconds_total[5m]))
图例结果

9、下面设置一个rules规则,写一个文件 prometheus.rules.yml
- groups:
- - name: cpu-node
- rules:
- - record: job_instance_mode:node_cpu_seconds:avg_rate5m
- expr: avg by (job, instance, mode) (rate(node_cpu_seconds_total[5m]))
10、现在发现配置文件太多了 我们重新用另一种方式启动docker 优化一下 把本地配置文件都放在 /opt/prometheus/,原来的docker可删除了。
- --web.enable-lifecycle 参数支持热更新 接口是curl -X POST http://192.168.246.2:9090/-/reload
- docker run -itd -p 9090:9090 -v /opt/prometheus/:/etc/prometheus/ prom/prometheus --config.file=/etc/prometheus/prometheus.yml --web.enable-lifecycle
11、查看rules

12、上面只是规则,并没有告警,我们假设 avg by (job, instance, mode) (rate(node_cpu_seconds_total[5m])) > 0.5 就触发 cpu警告 这是假设的测试
我们需要rules文件如下:
- groups:
- - name: example
- rules:
- - alert: HighCpuLatency
- expr: avg by (job, instance, mode) (rate(node_cpu_seconds_total[5m])) > 0.5
- for: 10s
- labels:
- severity: page
- annotations:
- summary: High request latency
写到prometheus.rules.yml文件中 ,注意groups不能复制进去 key不能重复 可以使用命令检查rules文件是否正确
- [root@test prometheus]# ./prometheus-2.26.0.linux-amd64/promtool check rules prometheus.rules.yml
- Checking prometheus.rules.yml
- FAILED:
- prometheus.rules.yml: yaml: unmarshal errors:
- line 6: mapping key "groups" already defined at line 1
- prometheus.rules.yml: yaml: unmarshal errors:
- line 6: mapping key "groups" already defined at line 1
- [root@test prometheus]# ./prometheus-2.26.0.linux-amd64/promtool check rules prometheus.rules.yml
- Checking prometheus.rules.yml
- SUCCESS: 2 rules found
- [root@test prometheus]#
13、热更新一下
- curl -X POST http://192.168.246.2:9090/-/reload
这次不用重启docker了
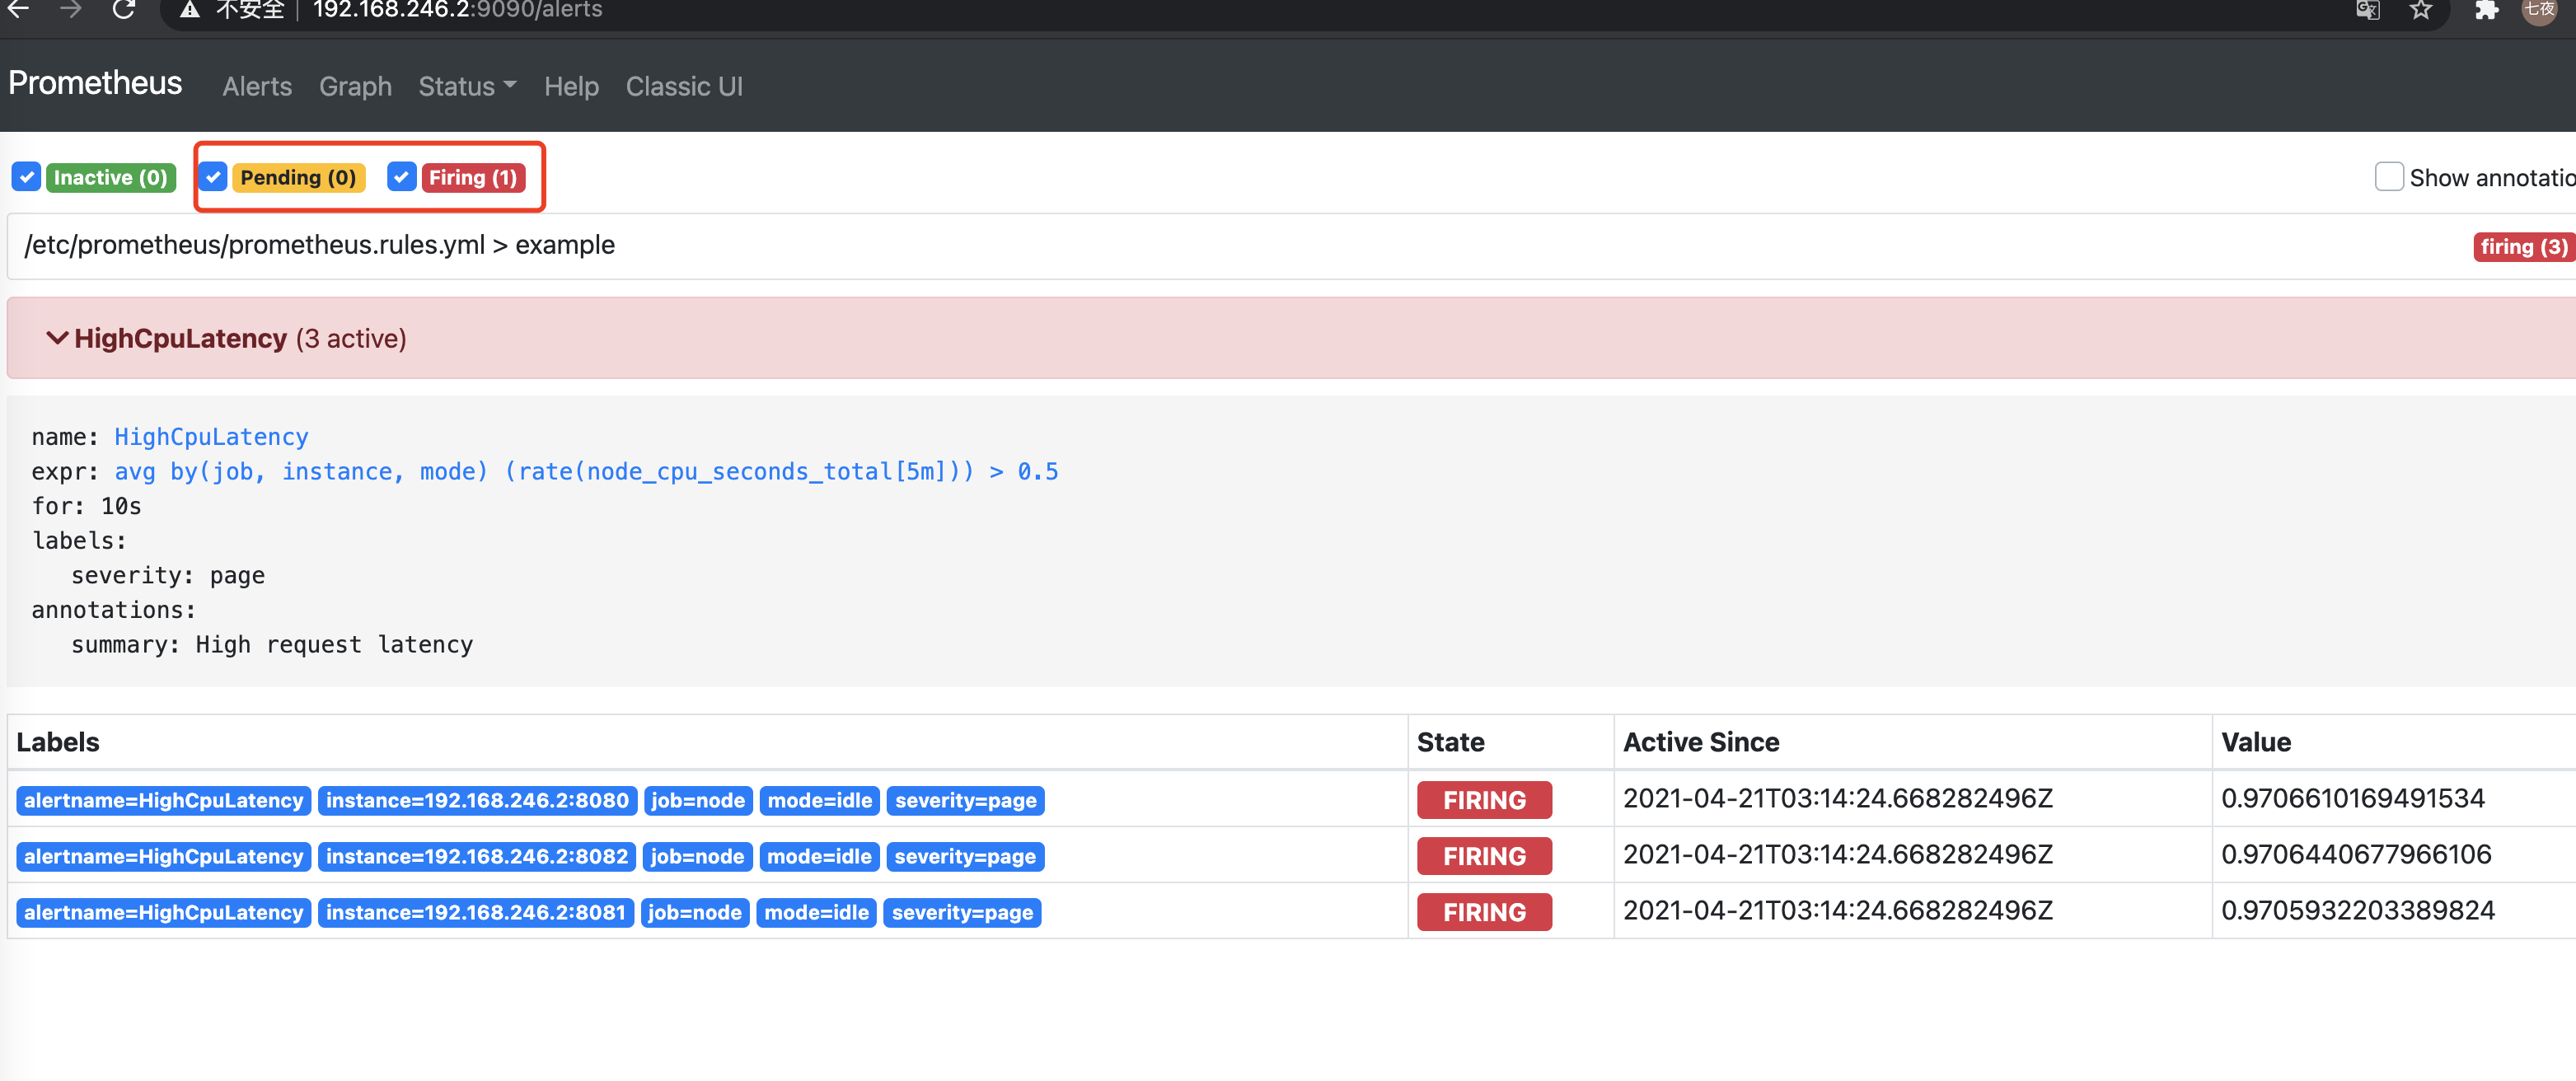
查看页面 rules会增加一个 且alert会先有pending状态,等符合条件后就触发告警
14、下面启动alertmanager
启动之前要做两个配置,首先把 alertmanager 的IP和端口配置到prometheus.yml中
最会面增加了 alerting的配置 这样 prometheus 就连上 alertmanager
- global:
- scrape_interval: 15s # By default, scrape targets every 15 seconds.
- # Attach these labels to any time series or alerts when communicating with
- # external systems (federation, remote storage, Alertmanager).
- external_labels:
- monitor: 'codelab-monitor'
- rule_files:
- - 'prometheus.rules.yml'
- # A scrape configuration containing exactly one endpoint to scrape:
- # Here it's Prometheus itself.
- scrape_configs:
- # The job name is added as a label `job=<job_name>` to any timeseries scraped from this config.
- - job_name: 'prometheus'
- # Override the global default and scrape targets from this job every 5 seconds.
- scrape_interval: 5s
- static_configs:
- - targets: ['localhost:9090']
- - job_name: 'node'
- # Override the global default and scrape targets from this job every 5 seconds.
- scrape_interval: 5s
- static_configs:
- - targets: ['192.168.246.2:8080', '192.168.246.2:8081']
- labels:
- group: 'production'
- - targets: ['192.168.246.2:8082']
- labels:
- group: 'canary'
- alerting:
- alertmanagers:
- - static_configs:
- - targets: ["192.168.246.2:9093"]
第二个配置 我们先测试邮件告警,写的 alertmanager 配置如下
注意修改的部分 qq如何申请授权码请百度一下
- smtp_smarthost: 'smtp.qq.com:465'
- smtp_from: '6171391@qq.com'
- smtp_auth_username: '6171391@qq.com'
- smtp_auth_password: 'qq授权码'
- smtp_require_tls: false
默认不做任何过滤选择的接收人
- - to: 'dfwl@163.com'
- global:
- # The smarthost and SMTP sender used for mail notifications.
- smtp_smarthost: 'smtp.qq.com:465'
- smtp_from: '6171391@qq.com'
- smtp_auth_username: '6171391@qq.com'
- smtp_auth_password: 'qq授权码'
- smtp_require_tls: false
- # The directory from which notification templates are read.
- templates:
- - '/etc/alertmanager/template/*.tmpl'
- # The root route on which each incoming alert enters.
- route:
- group_by: ['alertname', 'cluster', 'service']
- group_wait: 30s
- # When the first notification was sent, wait 'group_interval' to send a batch
- # of new alerts that started firing for that group.
- group_interval: 1m
- # If an alert has successfully been sent, wait 'repeat_interval' to
- # resend them.
- repeat_interval: 7h
- # A default receiver
- receiver: team-X-mails
- # The child route trees.
- routes:
- # This routes performs a regular expression match on alert labels to
- # catch alerts that are related to a list of services.
- - match_re:
- service: ^(foo1|foo2|baz)$
- receiver: team-X-mails
- # The service has a sub-route for critical alerts, any alerts
- # that do not match, i.e. severity != critical, fall-back to the
- # parent node and are sent to 'team-X-mails'
- routes:
- - match:
- severity: critical
- receiver: team-X-pager
- - match:
- service: files
- receiver: team-Y-mails
- routes:
- - match:
- severity: critical
- receiver: team-Y-pager
- # This route handles all alerts coming from a database service. If there's
- # no team to handle it, it defaults to the DB team.
- - match:
- service: database
- receiver: team-DB-pager
- # Also group alerts by affected database.
- group_by: [alertname, cluster, database]
- routes:
- - match:
- owner: team-X
- receiver: team-X-pager
- continue: true
- - match:
- owner: team-Y
- receiver: team-Y-pager
- # Inhibition rules allow to mute a set of alerts given that another alert is
- # firing.
- # We use this to mute any warning-level notifications if the same alert is
- # already critical.
- inhibit_rules:
- - source_match:
- severity: 'critical'
- target_match:
- severity: 'warning'
- # Apply inhibition if the alertname is the same.
- # CAUTION:
- # If all label names listed in `equal` are missing
- # from both the source and target alerts,
- # the inhibition rule will apply!
- equal: ['alertname', 'cluster', 'service']
- receivers:
- - name: 'team-X-mails'
- email_configs:
- - to: 'dfwl@163.com'
- - name: 'team-X-pager'
- email_configs:
- - to: 'team-X+alerts-critical@example.org'
- pagerduty_configs:
- - service_key: <team-X-key>
- - name: 'team-Y-mails'
- email_configs:
- - to: 'team-Y+alerts@example.org'
- - name: 'team-Y-pager'
- pagerduty_configs:
- - service_key: <team-Y-key>
- - name: 'team-DB-pager'
- pagerduty_configs:
- - service_key: <team-DB-key>
15、手动启动测试一下 生产环境可以docker或k8s等方式启动
./alertmanager --config.file=alertmanager.yml
16、alertmanager页面能同步到告警
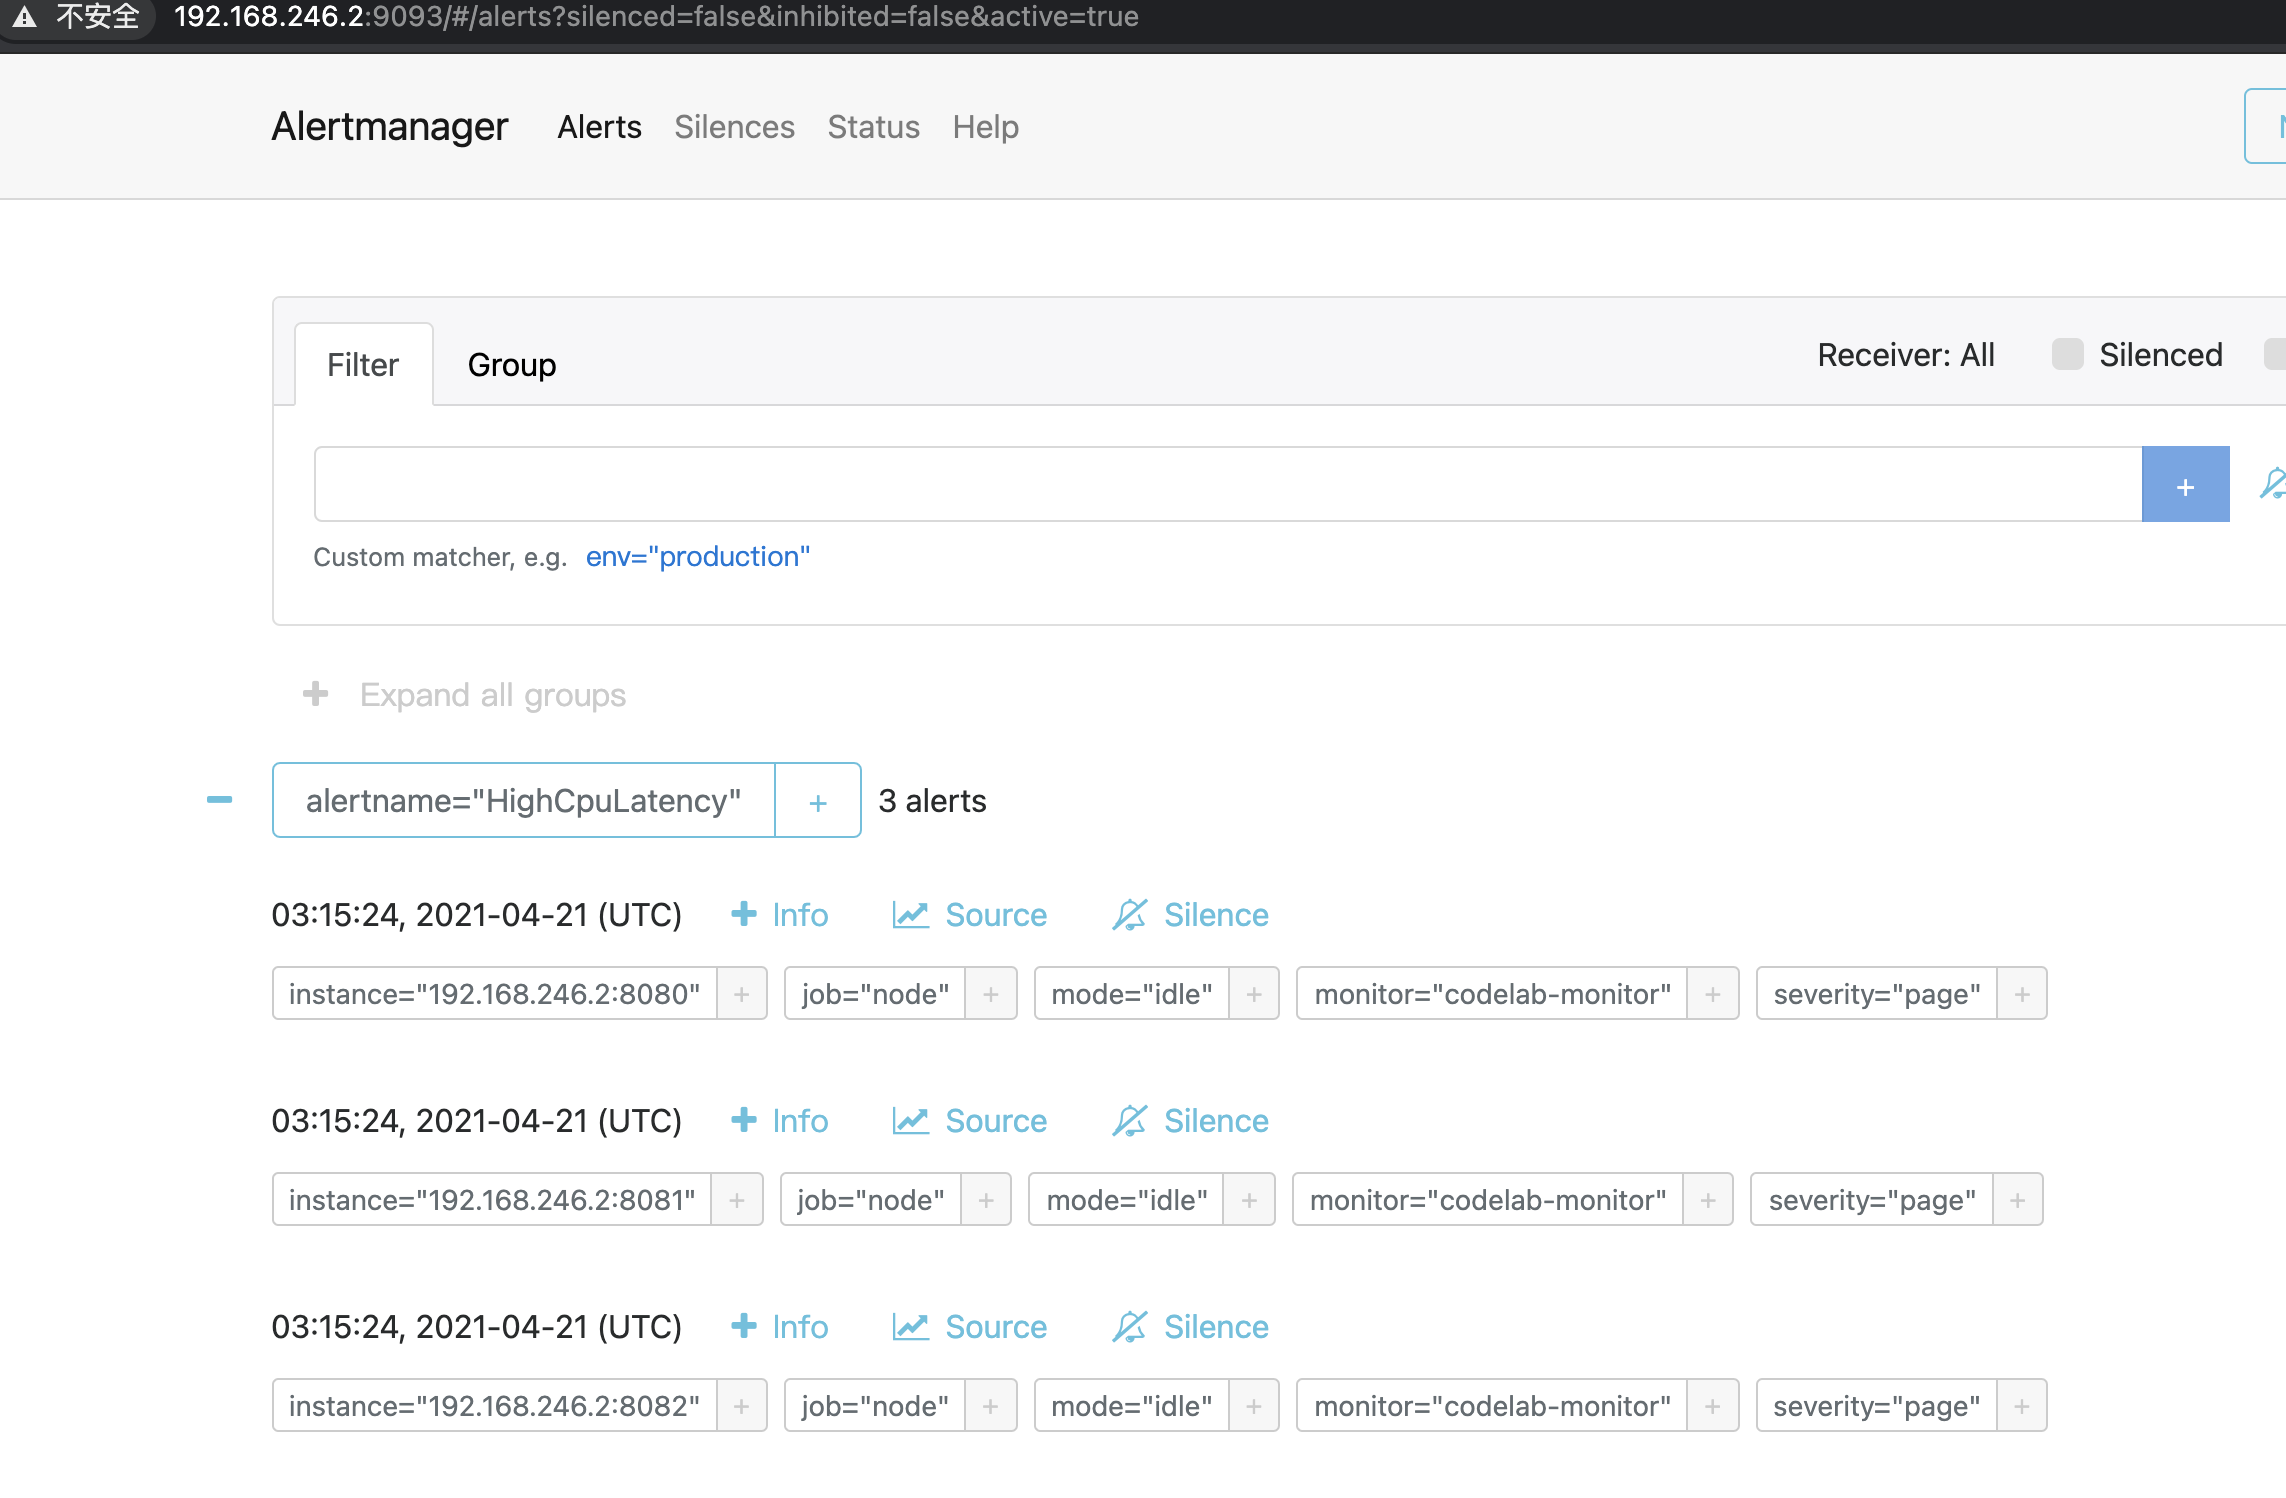
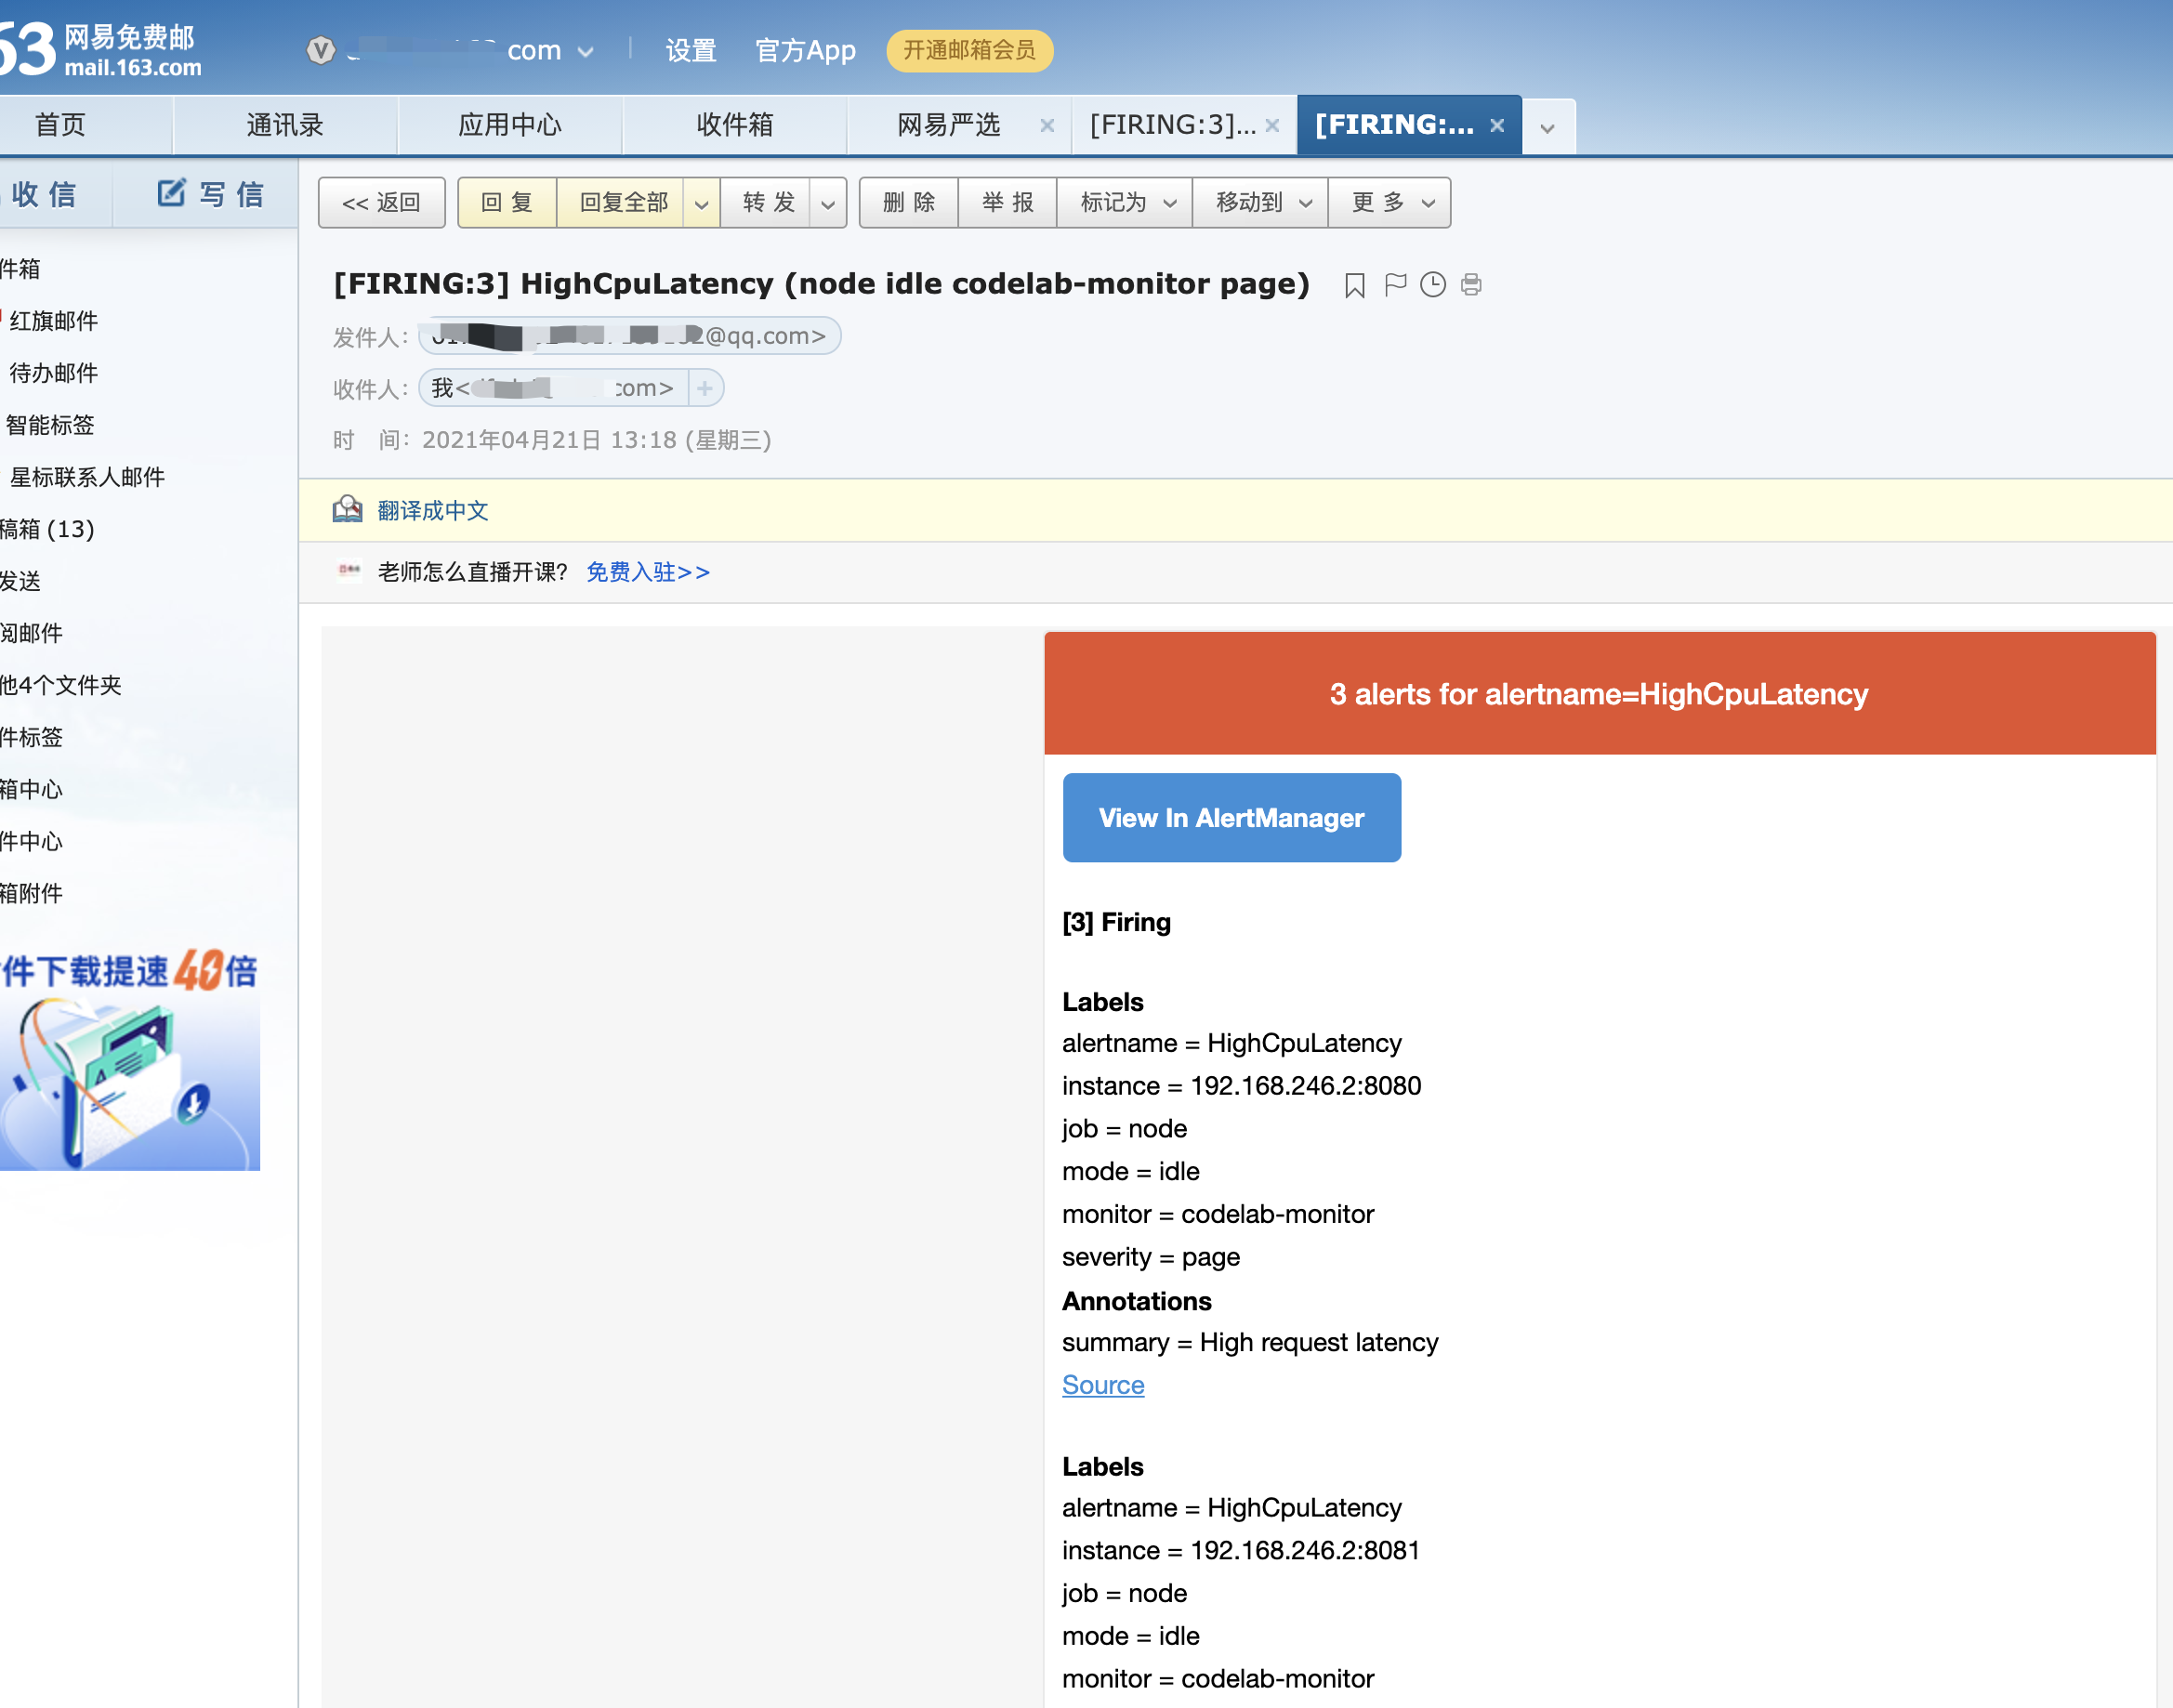
过一会就会发邮件了
- group_interval: 1m 意思 从第一次接受告警1m后还在就发
prometheus从零开始的更多相关文章
- 从零开始搭建Prometheus自动监控报警系统
从零搭建Prometheus监控报警系统 什么是Prometheus? Prometheus是由SoundCloud开发的开源监控报警系统和时序列数据库(TSDB).Prometheus使用Go语言开 ...
- 从零开始学习Prometheus监控报警系统
Prometheus简介 Prometheus是一个开源的监控报警系统,它最初由SoundCloud开发. 2016年,Prometheus被纳入了由谷歌发起的Linux基金会旗下的云原生基金会( C ...
- Prometheus监控学习记录
官方文档 Prometheus基础文档 从零开始:Prometheus 进阶之路:Prometheus —— 技巧篇 进阶之路:Prometheus —— 理解篇 prometheus的数据类型介绍 ...
- 基于prometheus监控k8s集群
本文建立在你已经会安装prometheus服务的基础之上,如果你还不会安装,请参考:prometheus多维度监控容器 如果你还没有安装库k8s集群,情参考: 从零开始搭建基于calico的kuben ...
- kubernetes 1.15.1 高可用部署 -- 从零开始
这是一本书!!! 一本写我在容器生态圈的所学!!! 重点先知: 1. centos 7.6安装优化 2. k8s 1.15.1 高可用部署 3. 网络插件calico 4. dashboard 插件 ...
- 你必须知道的容器监控 (3) Prometheus
本篇已加入<.NET Core on K8S学习实践系列文章索引>,可以点击查看更多容器化技术相关系列文章.上一篇介绍了Google开发的容器监控工具cAdvisor,但是其提供的操作界面 ...
- 从零搭建Prometheus监控报警系统
什么是Prometheus? Prometheus是由SoundCloud开发的开源监控报警系统和时序列数据库(TSDB).Prometheus使用Go语言开发,是Google BorgMon监控系统 ...
- 3W字干货深入分析基于Micrometer和Prometheus实现度量和监控的方案
前提 最近线上的项目使用了spring-actuator做度量统计收集,使用Prometheus进行数据收集,Grafana进行数据展示,用于监控生成环境机器的性能指标和业务数据指标.一般,我们叫这样 ...
- Prometheus入门教程(二):Prometheus + Grafana实现可视化、告警
文章首发于[陈树义]公众号,点击跳转到原文:https://mp.weixin.qq.com/s/56S290p4j9KROB5uGRcGkQ Prometheus UI 提供了快速验证 PromQL ...
随机推荐
- 四、C#简单操作MinIO
MinIO的官方网站非常详细,以下只是本人学习过程的整理 一.MinIO的基本概念 二.Windows安装与简单使用MinIO 三.Linux部署MinIO分布式集群 四.C#简单操作MinIO He ...
- 天梯赛 L1-058 6翻了
传送门:https://pintia.cn/problem-sets/994805046380707840/problems/1111914599408664577 这道字符串题,只是天梯赛L1的题, ...
- Linux的磁盘管理和文件系统
一.磁盘结构 1.1.硬盘的物理结构 盘头:硬盘有多个盘片,每盘片2面 磁头:每面一个磁头 1.2.硬盘的数据结构 扇区:盘片被分为多个扇形区域,每个扇区存放512字节的数据,硬盘的最小存储单位 磁道 ...
- Shell-12-linux信号
信号类型 信号:信号是在软件层次上对中断机制的一种模拟,通过给一个进程发送信号,执行相应的处理函数 进程可以通过三种方式来响应一个信号: 1.忽略信号,即对信号不做任何处理,其中有两个信号不能忽略: ...
- 【笔记】集成学习入门之soft voting classifier和hard voting classifier
集成学习入门之soft voting classifier和hard voting classifier 集成学习 通过构建并结合多个学习器来完成学习任务,一般是先产生一组"个体学习器&qu ...
- tomcat9配置https-pfx
下载tomcat9 wget https://mirrors.bfsu.edu.cn/apache/tomcat/tomcat-9/v9.0.37/bin/apache-tomcat-9.0.37.t ...
- springboot分页插件的使用
在springboot工程下的pom.xml中添加依赖 <!--分页 pagehelper --> <dependency> <groupId>com.github ...
- 请问在电脑里PNP是什么意思啊?
PnP(Plug and Play,即插即用)是指用户不必干预计算机的各个外围设备对系统资源的分配,而将这一繁杂的工作交给系统,由系统自身去解决底层硬件资源,包括IRQ(中断请求).I/O(输入输出端 ...
- dataTemplate 之 ContentTemplate 的使用
<Window x:Class="WpfApplication1.Window38" xmlns="http://schemas.microsoft.com/win ...
- springMVC学习日志一
一.springMVC流程图省略 二.写一个简单的springmvc的demo来说明 2.1引入springMVC相关的jar包 2.2配置DispatcherServlet 在web.xml < ...