《DSP using MATLAB》示例Example4.15
代码:
b = [1/3, 1/3, 1/3]; a = [1, -0.95, 0.9025]; % x(n) y(n) coefficient [R, p, C] = residuez(b,a) Mp = (abs(p))', Ap = (angle(p))'/pi % polar form Y = [-2, -3]; X =[1, 1]; xic = filtic(b,a,Y,X); %% ----------------------------------------------
%% START a determine H(z) and sketch
%% ----------------------------------------------
figure('NumberTitle', 'off', 'Name', 'Example4.15 H(z) its pole-zero plot')
set(gcf,'Color','white');
zplane(b,a);
title('pole-zero plot'); grid on; %% ----------------------------------------------
%% END
%% ---------------------------------------------- bxplus = [1, -0.5]; axplus = [1, -1, 1]; % X(z) transform coeff
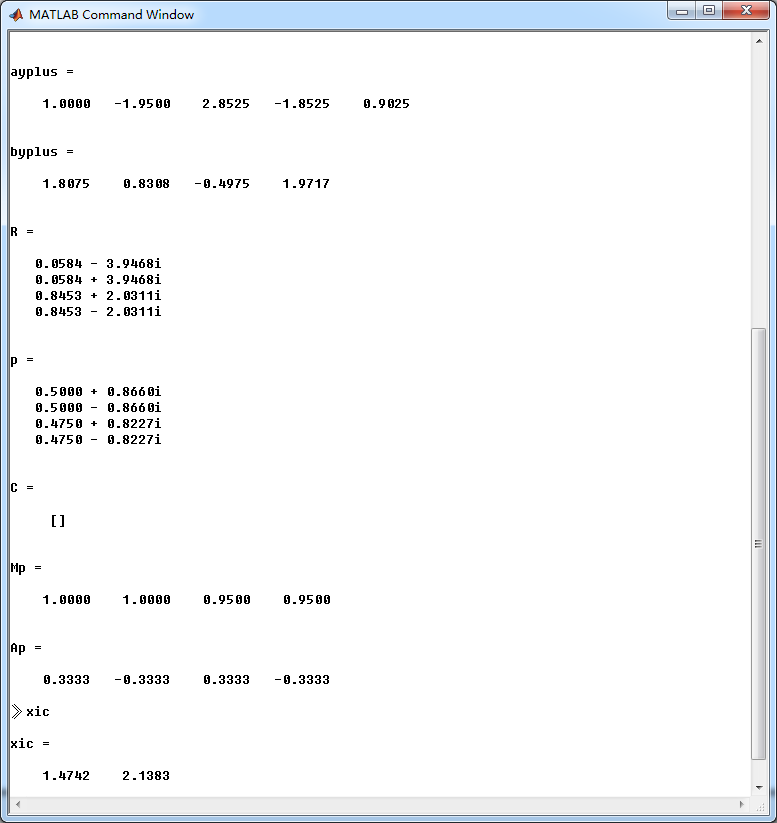
ayplus = conv(a, axplus) % Denominator of Yplus(z)
byplus = conv(b,bxplus) + conv(xic,axplus) % Numerator of Yplus(z) [R, p, C] = residuez(byplus, ayplus)
Mp = (abs(p))' , Ap = (angle(p))'/pi % polar form %% --------------------------------------------------------------
%% START b |H| <H
%% 1st form of freqz
%% --------------------------------------------------------------
[H,w] = freqz(b,a,500); % 1st form of freqz magH = abs(H); angH = angle(H); realH = real(H); imagH = imag(H); %% ================================================
%% START H's mag ang real imag
%% ================================================
figure('NumberTitle', 'off', 'Name', 'Example4.15 H its mag ang real imag');
set(gcf,'Color','white');
subplot(2,2,1); plot(w/pi,magH); grid on; %axis([0,1,0,1.5]);
title('Magnitude Response');
xlabel('frequency in \pi units'); ylabel('Magnitude |H|');
subplot(2,2,3); plot(w/pi, angH/pi); grid on; % axis([-1,1,-1,1]);
title('Phase Response');
xlabel('frequency in \pi units'); ylabel('Radians/\pi'); subplot('2,2,2'); plot(w/pi, realH); grid on;
title('Real Part');
xlabel('frequency in \pi units'); ylabel('Real');
subplot('2,2,4'); plot(w/pi, imagH); grid on;
title('Imaginary Part');
xlabel('frequency in \pi units'); ylabel('Imaginary');
%% ==================================================
%% END H's mag ang real imag
%% ================================================== %% ---------------------------------------------------------------
%% END b |H| <H
%% --------------------------------------------------------------- %% --------------------------------------------------------------
%% START b |H| <H
%% 3rd form of freqz
%% --------------------------------------------------------------
w = [0:1:500]*pi/500; H = freqz(b,a,w);
%[H,w] = freqz(b,a,200,'whole'); % 3rd form of freqz magH = abs(H); angH = angle(H); realH = real(H); imagH = imag(H); %% ================================================
%% START H's mag ang real imag
%% ================================================
figure('NumberTitle', 'off', 'Name', 'Example4.15 using 3rd form freqz ');
set(gcf,'Color','white');
subplot(2,2,1); plot(w/pi,magH); grid on; %axis([0,1,0,1.5]);
title('Magnitude Response');
xlabel('frequency in \pi units'); ylabel('Magnitude |H|');
subplot(2,2,3); plot(w/pi, angH/pi); grid on; % axis([-1,1,-1,1]);
title('Phase Response');
xlabel('frequency in \pi units'); ylabel('Radians/\pi'); subplot('2,2,2'); plot(w/pi, realH); grid on;
title('Real Part');
xlabel('frequency in \pi units'); ylabel('Real');
subplot('2,2,4'); plot(w/pi, imagH); grid on;
title('Imaginary Part');
xlabel('frequency in \pi units'); ylabel('Imaginary');
%% ==================================================
%% END H's mag ang real imag
%% ================================================== %% ---------------------------------------------------------------
%% END b |H| <H
%% --------------------------------------------------------------- %% START Check
n = [0:7]; x = cos(pi*n/3); y_ori = filter(b,a,x,xic) %% MATLAB verification
A = real(2*R(1)); B = imag(2*R(1)); C = real(2*R(3)); D = imag(2*R(4));
y_check = A*cos(pi*n/3) + B *sin(pi*n/3) + ((0.95).^n) .* (C*cos(pi*n/3) + D*sin(pi*n/3))
结果:
《DSP using MATLAB》示例Example4.15的更多相关文章
- DSP using MATLAB 示例 Example3.15
上代码: subplot(1,1,1); b = 1; a = [1, -0.8]; n = [0:100]; x = cos(0.05*pi*n); y = filter(b,a,x); figur ...
- DSP using MATLAB 示例Example3.21
代码: % Discrete-time Signal x1(n) % Ts = 0.0002; n = -25:1:25; nTs = n*Ts; Fs = 1/Ts; x = exp(-1000*a ...
- DSP using MATLAB 示例 Example3.19
代码: % Analog Signal Dt = 0.00005; t = -0.005:Dt:0.005; xa = exp(-1000*abs(t)); % Discrete-time Signa ...
- DSP using MATLAB示例Example3.18
代码: % Analog Signal Dt = 0.00005; t = -0.005:Dt:0.005; xa = exp(-1000*abs(t)); % Continuous-time Fou ...
- DSP using MATLAB 示例 Example3.11
用到的性质 上代码: n = -5:10; x = rand(1,length(n)); k = -100:100; w = (pi/100)*k; % freqency between -pi an ...
- DSP using MATLAB 示例Example3.9
用到的性质 上代码: n = 0:100; x = cos(pi*n/2); k = -100:100; w = (pi/100)*k; % freqency between -pi and +pi ...
- DSP using MATLAB 示例Example3.8
代码: x = rand(1,11); n = 0:10; k = 0:500; w = (pi/500)*k; % [0,pi] axis divided into 501 points. X = ...
- DSP using MATLAB 示例Example3.7
上代码: x1 = rand(1,11); x2 = rand(1,11); n = 0:10; alpha = 2; beta = 3; k = 0:500; w = (pi/500)*k; % [ ...
- DSP using MATLAB示例Example3.6
代码: n = [-5:5]; x = (-0.9).^n; % x(n) = k = -200:200; w = (pi/100)*k; % [0,pi] axis divided into 101 ...
随机推荐
- VC++ 获取当前模块的路径(dll/exe)
一般地,获取当前模块路径都是通过调用 GetModuleFileName() 来获取的. DWORD WINAPI GetModuleFileName( __in HMODULE hModule, _ ...
- plsql客户端显示菜单等
不小心把plsql的左边的都关了,如图 菜单条---工具---浏览器. 即可.
- mybatis跨XML引用
resultMap中association标签的select属性使用嵌套查询的时候需要引用其它xml文件的配置 此时可以用要引用xml的namespace.引用select的ID 如 <resu ...
- 从API请求数据的方法(主要适用于tp5)
// 从api获取数据,$data是一个数组,默认为空,请求数据的方法可以通用,但是其它说明只适用于tp5 function postData($url,$data=''){ $ch = curl_i ...
- 【leetcode】Best Time to Buy and Sell 3 (hard) 自己做出来了 但别人的更好
Say you have an array for which the ith element is the price of a given stock on day i. Design an al ...
- HDU 5884 Sort -2016 ICPC 青岛赛区网络赛
题目链接 #include <iostream> #include <math.h> #include <stdio.h> #include<algorith ...
- NEFU 506&&ZOJ 3353 Chess Board (四种构造的高斯消元)
题目链接 题意:有四种翻转方式,问是否能使得所有棋子都变为0,求最小步数. 题解:依次构造枚举求出最小值即可. #include <iostream> #include <cstdi ...
- hdu1115(计算多边形几何重心)
题目链接:http://acm.hdu.edu.cn/showproblem.php?pid=1115 题意:给出一些点,求这些点围成的多边形的重心: 思路: 方法1:直接分别求所有点的x坐标的平均值 ...
- Swift - 推送之本地推送(UILocalNotification)
// 本地推送通知是通过实例化UILocalNotification实现的.要实现本地化推送可以在AppDelegate.swift中添加代码实现,本事例是一个当App进入后台时推送一条消息给用户. ...
- iOS - OC/Swift:验证手机号/固话用正则表达式
/** * 验证手机号是否正确 * @param unknown_type $mobile */ OC: - (BOOL)isMobileNumber:(NSString *)mobileNum { ...