部署 Prometheus 和 Grafana 到 k8s
在 k8s 中部署 Prometheus 和 Grafana
Intro
上次我们主要分享了 asp.net core 集成 prometheus,以及简单的 prometheus 使用,在实际在 k8s 中部署的时候就不能在使用前面讲的静态配置的方式来部署了,需要使用 Prometheus 的服务发现。
部署规划
Prometheus 和 Grafana 的部署放在一个单独的 namespace —— monitoring 下面,这样的好处在于可以屏蔽掉一些细节,别的 namespace 无感知,也不需要知道它们的存在
可以使用 kubectl create namespace monitoring 来创建命名空间或者 kubectl apply 执行下面的 yaml 配置
apiVersion: v1

kind: Namespace

metadata:

  name: monitoring
希望 prometheus 和 grafana 可以公网访问,所以需要配置一下端口号,NodePort 31100~31200 保留为基础设施使用的端口,31110 保留为 prometheus 需要的端口,31120 保留为 Grafana 端口,端口规划好后,就可以先配置 nginx 了,增加 nginx 配置如下:
server {

    listen 443;

    server_name monitoring.weihanli.xyz;

    location / {

        proxy_pass http://172.18.0.2:31110;

        proxy_set_header X-Real-IP $remote_addr;

        proxy_set_header X-Forwarded-For $proxy_add_x_forwarded_for;

    }

}

server {

    listen 443;

    server_name grafana.weihanli.xyz;

    location / {

        proxy_pass http://172.18.0.2:31120;

        proxy_set_header X-Real-IP $remote_addr;

        proxy_set_header X-Forwarded-For $proxy_add_x_forwarded_for;

    }

}
Grafana 比较简单,部署一个 service,部署一个 deployment 就可以了,Prometheus 要把配置文件放到 ConfigMap 里单独管理,另外 Prometheus 涉及到要使用 k8s 服务发现,需要创建一个 serviceAccount 以有权限来获取 k8s 中的资源
部署 Grafana
部署 deployment,deployment yaml 如下,可以根据自己需要进行调整
apiVersion: apps/v1

kind: Deployment

metadata:

  name: grafana

  namespace: monitoring

  labels:

    app: grafana

spec:

  replicas: 1

  revisionHistoryLimit: 2

  selector:

    matchLabels:

      app: grafana

  minReadySeconds: 0

  strategy:

    type: RollingUpdate

    rollingUpdate:

      maxUnavailable: 1

      maxSurge: 1

  template:

    metadata:

      labels:

        app: grafana

    spec:

      containers:

        - name: grafana

          image: grafana/grafana

          imagePullPolicy: IfNotPresent

          resources:

            limits:

              memory: "128Mi"

              cpu: "50m"

          readinessProbe:

            httpGet:

              path: /api/health

              port: 3000

            initialDelaySeconds: 60

            periodSeconds: 10

          livenessProbe:

            tcpSocket:

              port: 3000

            initialDelaySeconds: 60

            periodSeconds: 10

          ports:

            - containerPort: 3000
根据上面的 yaml 定义创建 Grafana 的 deploy,创建之后再创建 service
apiVersion: v1

kind: Service

metadata:

  name: grafana

  namespace: monitoring

spec:

  selector:

    app: grafana

  type: NodePort

  ports:

  - protocol: TCP

    port: 3000

    targetPort: 3000

    nodePort: 31120
创建之后就可以在 k8s 集群外部访问到 Grafana 了,通过前面 nginx 的配置我们就可以直接通过域名访问了
部署 Prometheus
ServiceAccount
首先我们先创建一个 Service Account,k8s 使用基于角色的 RBAC 授权机制,创建 ServiceAccount 之后还需要创建一个 ClusterRole 和 ClusterRoleBinding,ClusterRole 用于指定权限,ClusteRoleBinding 用来给 serviceAccount 关联角色,为了方便这几个都定义在了一个 yaml 文件中
apiVersion: v1

kind: ServiceAccount

metadata:

  name: prometheus

  namespace: monitoring

---

apiVersion: rbac.authorization.k8s.io/v1

kind: ClusterRole

metadata:

  name: prometheus

rules:

- apiGroups: [""]

  resources:

  - nodes

  - services

  - endpoints

  - pods

  verbs: ["get", "list", "watch"]

- apiGroups: [""]

  resources:

  - configmaps

  verbs: ["get"]

- nonResourceURLs: ["/metrics"]

  verbs: ["get"]

---

apiVersion: rbac.authorization.k8s.io/v1

kind: ClusterRoleBinding

metadata:

  name: prometheus

roleRef:

  apiGroup: rbac.authorization.k8s.io

  kind: ClusterRole

  name: prometheus

subjects:

- kind: ServiceAccount

  name: prometheus

  namespace: monitoring
ConfigMap
创建 ServiceAccount 之后,我们创建 Prometheus 的配置文件,放在 ConfigMap 中挂载在 Prometheus 里
apiVersion: v1

kind: ConfigMap

metadata:

  name: prometheus-config

  namespace: monitoring

data:

  default: |

    # my global config

    global:

      scrape_interval:     10s # Set the scrape interval to every 15 seconds. Default is every 1 minute.

      evaluation_interval: 15s # Evaluate rules every 15 seconds. The default is every 1 minute.

    # Load rules once and periodically evaluate them according to the global 'evaluation_interval'.

    rule_files:

      # - "first_rules.yml"

      # - "second_rules.yml"

    # A scrape configuration containing exactly one endpoint to scrape:

    scrape_configs:

      - job_name: 'kubernetes-service-endpoints'

        kubernetes_sd_configs:

        - role: endpoints

        relabel_configs:

        - source_labels: [__meta_kubernetes_service_annotation_prometheus_io_should_be_scraped]

          action: keep

          regex: true

        - action: labelmap

          regex: __meta_kubernetes_pod_label_(.+)

        - source_labels: [__meta_kubernetes_namespace]

          action: replace

          target_label: k8s_namespace

        - source_labels: [__meta_kubernetes_service_name]

          action: replace

          target_label: k8s_service

        - source_labels: [__meta_kubernetes_pod_name]

          separator: ;

          regex: (.*)

          replacement: $1

          target_label: k8s_pod

          action: replace
执行上面的 yaml 配置以部署 prometheus 需要的配置
我们可以利用 prometheus 的 relabel 的机制将一些元数据信息应用的 metrics 信息上,这样我们就可以知道这个 metrics 信息是来自哪一个 namespace 下面哪一个 service 哪一个 Pod 里,在 Prometheus targets 的界面可以看到所有的 metadata label,或者参考文档上的介绍 https://prometheus.io/docs/prometheus/latest/configuration/configuration#kubernetes_sd_config
__meta_kubernetes_service_annotation_prometheus_io_should_be_scraped 是我后面加上的,不加这个的话,会尝试从所有的 k8s 资源中获取 metrics 信息,这回导致很多没有集成 Prometheus metrics 的资源也会被持续访问,所以增加了这个配置,如果 service 里的 annotation 里有 prometheus.io/should_be_scraped 配置的话 Prometheus 才会去拉取 metrics 信息
需要 Prometheus 抓取 metrics 的 service 配置实力:
apiVersion: v1

kind: Service

metadata:

  name: reservation-server

  annotations:

    prometheus.io/should_be_scraped: "true"

spec:

  selector:

    app: reservation-server

  type: NodePort

  ports:

  - protocol: TCP

    port: 80

    targetPort: 80

    nodePort: 31220
如果后面需要配置不同的 metrics_path,也可以使用类似的模式来增加一个 prometheus.io/metrics-path 类似的配置转换成真正要拉取 metrics 信息的 path 即可
Deployment
前面 Prometheus 部署所需要的 serviceAccount 和 config 我们都已经准备好了,执行下面的 yaml 配置就可以部署应用了
apiVersion: apps/v1

kind: Deployment

metadata:

  name: prometheus

  namespace: monitoring

  labels:

    app: prometheus

spec:

  replicas: 1

  revisionHistoryLimit: 2 # how many old ReplicaSets for this Deployment you want to retain, https://kubernetes.io/docs/concepts/workloads/controllers/deployment/#clean-up-policy

  selector:

    matchLabels:

      app: prometheus

  minReadySeconds: 0

  strategy:

    type: RollingUpdate

    rollingUpdate:

      maxUnavailable: 1

      maxSurge: 1

  template:

    metadata:

      labels:

        app: prometheus

    spec:

      serviceAccountName: prometheus

      containers:

        - name: prometheus

          image: prom/prometheus

          imagePullPolicy: IfNotPresent

          resources:

            limits:

              memory: "512Mi"

              cpu: "200m"

          readinessProbe:

            httpGet:

              path: /-/ready

              port: 9090

            initialDelaySeconds: 60

            periodSeconds: 10

          livenessProbe:

            httpGet:

              path: /-/healthy

              port: 9090

            initialDelaySeconds: 60

            periodSeconds: 10

          ports:

            - containerPort: 80

          volumeMounts:

          - name: config

            mountPath: /etc/prometheus/prometheus.yml

            subPath: default

      volumes:

        - name: config

          configMap:

            name: prometheus-config
Service
deployment 创建之后,只要根据下面的配置创建 service 就可以访问了
apiVersion: v1

kind: Service

metadata:

  name: prometheus

  namespace: monitoring

spec:

  selector:

    app: prometheus

  type: NodePort

  ports:

  - protocol: TCP

    port: 9090

    targetPort: 9090

    nodePort: 31110
Sample
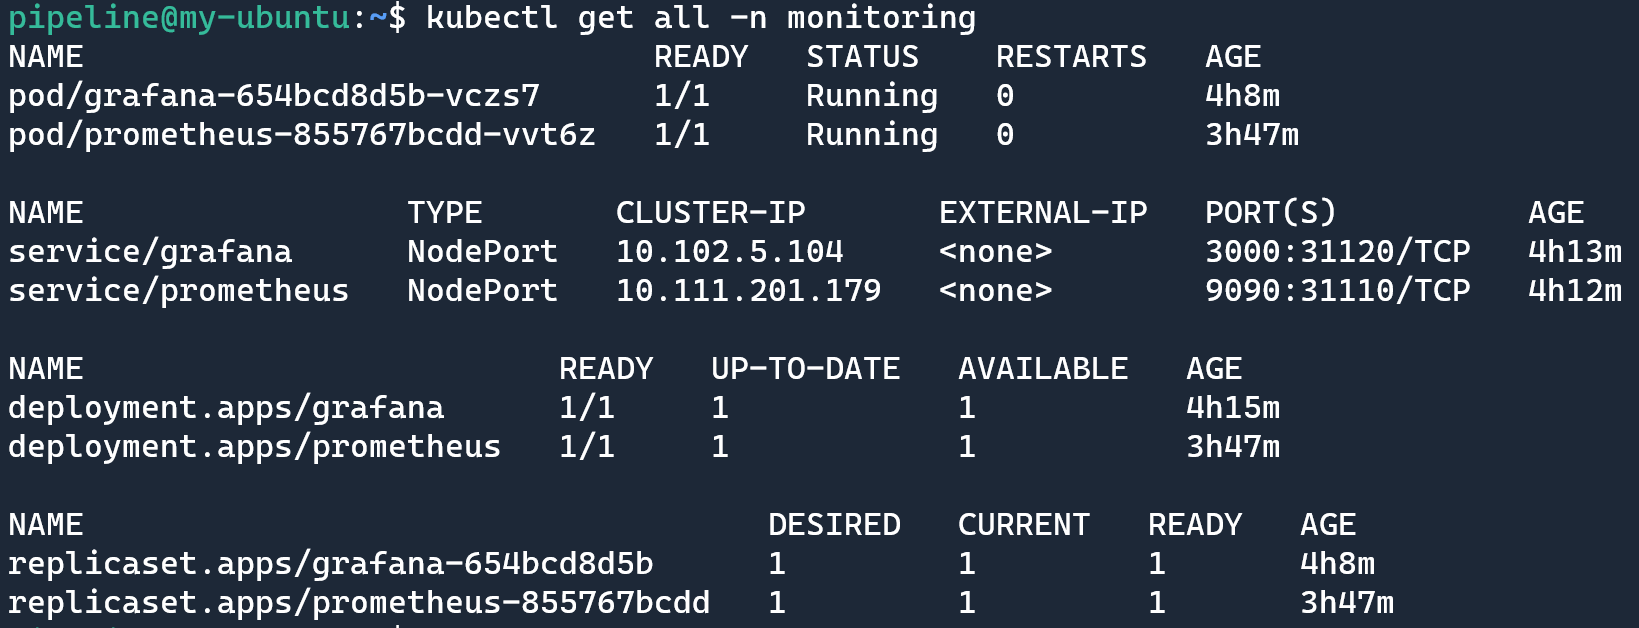
运行 kubectl get all -n monitoring 查看部署之后的资源情况:
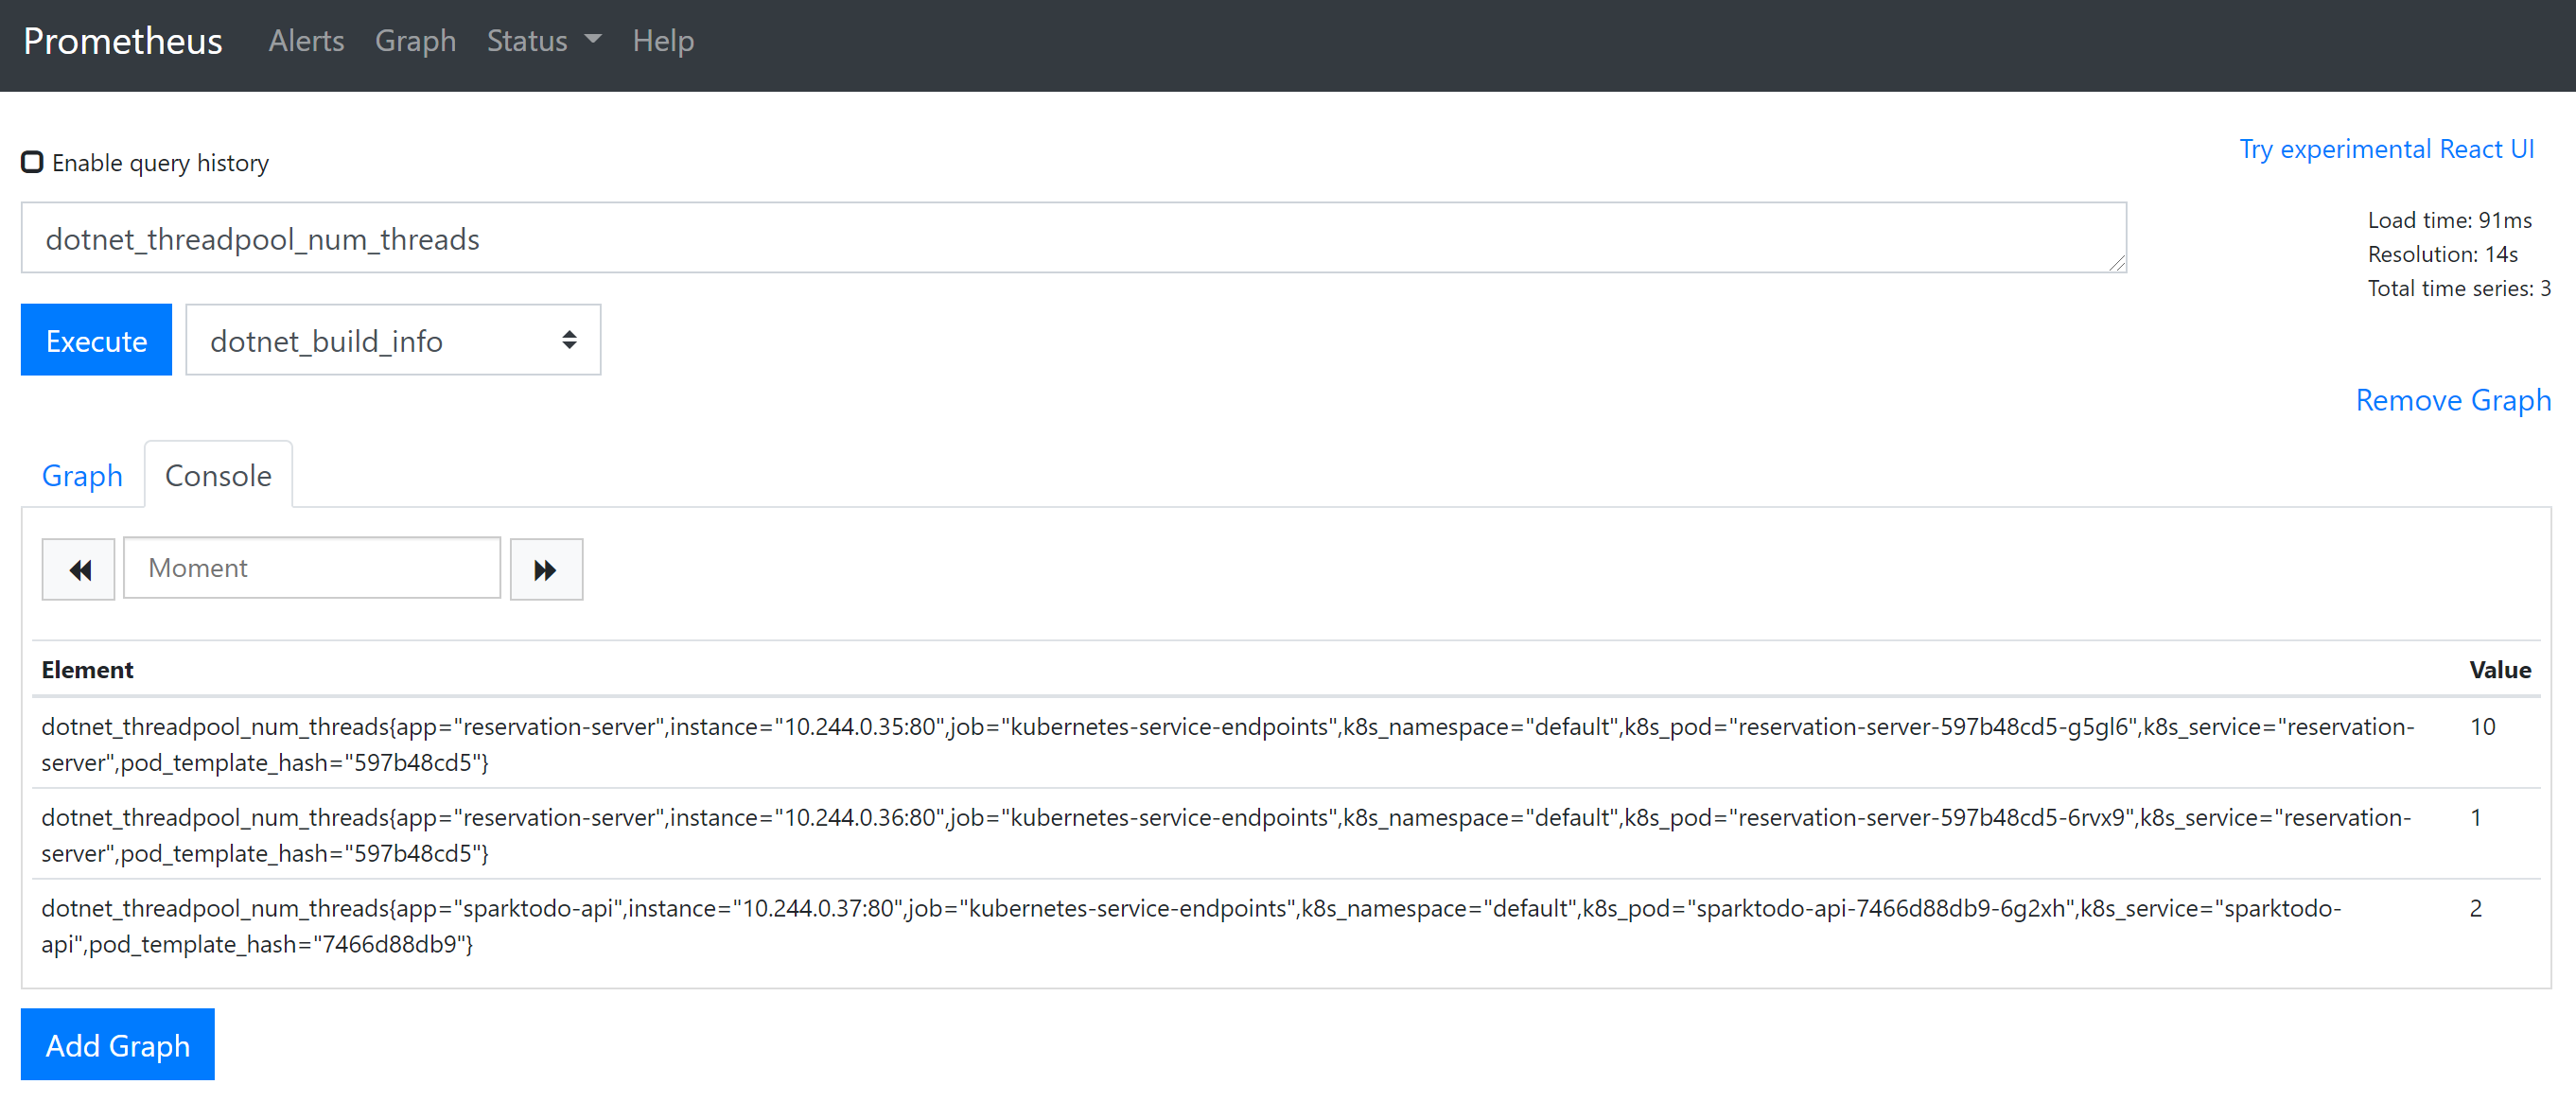
打开 prometheus 可以执行一个简单的查询,看一下
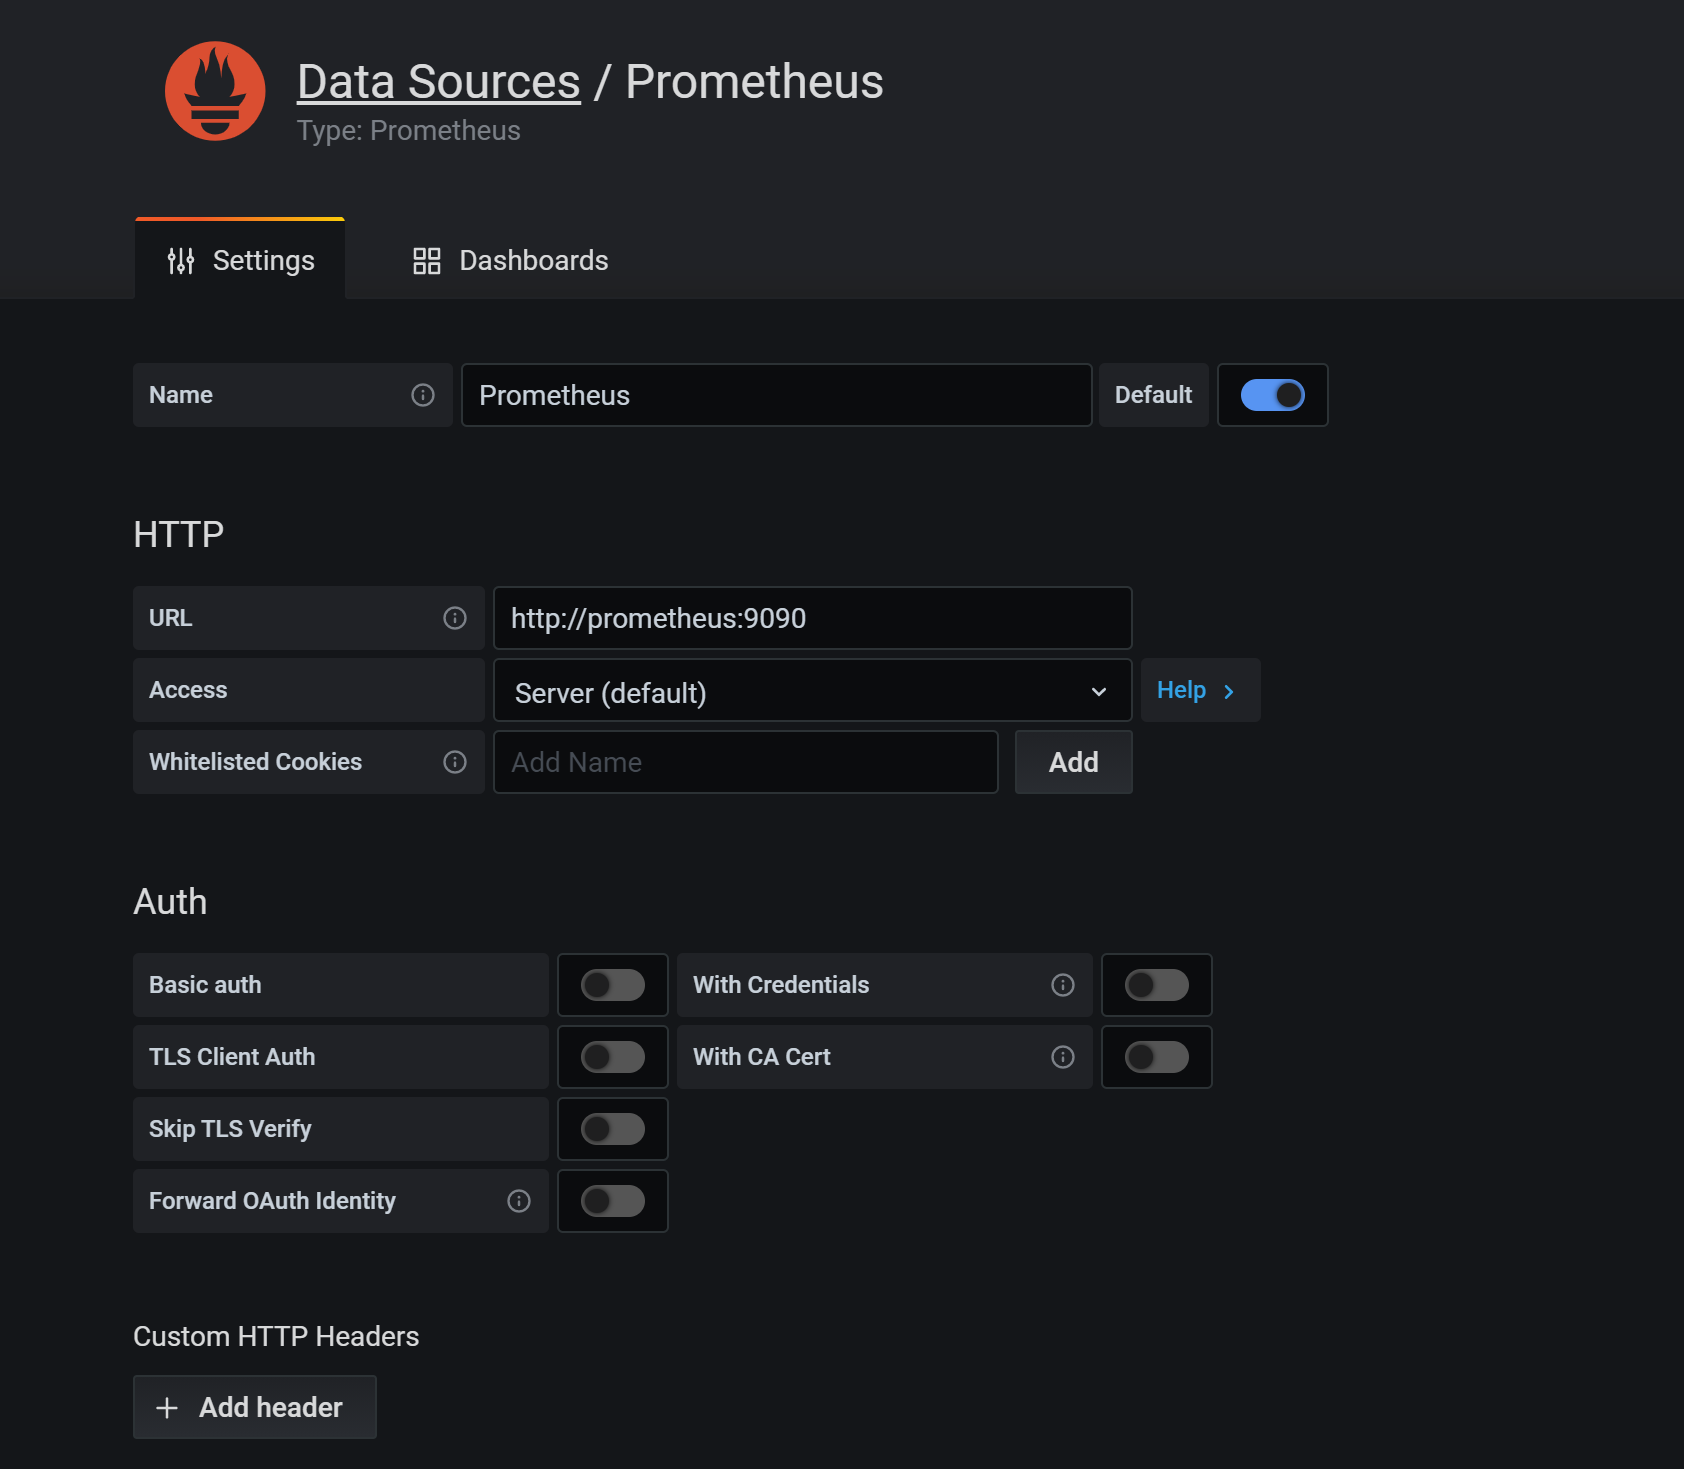
在 Grafana 中添加 DataSource,域名使用 service name prometheus 即可,这样可以通过内网去访问,就不需要绕公网走一圈了
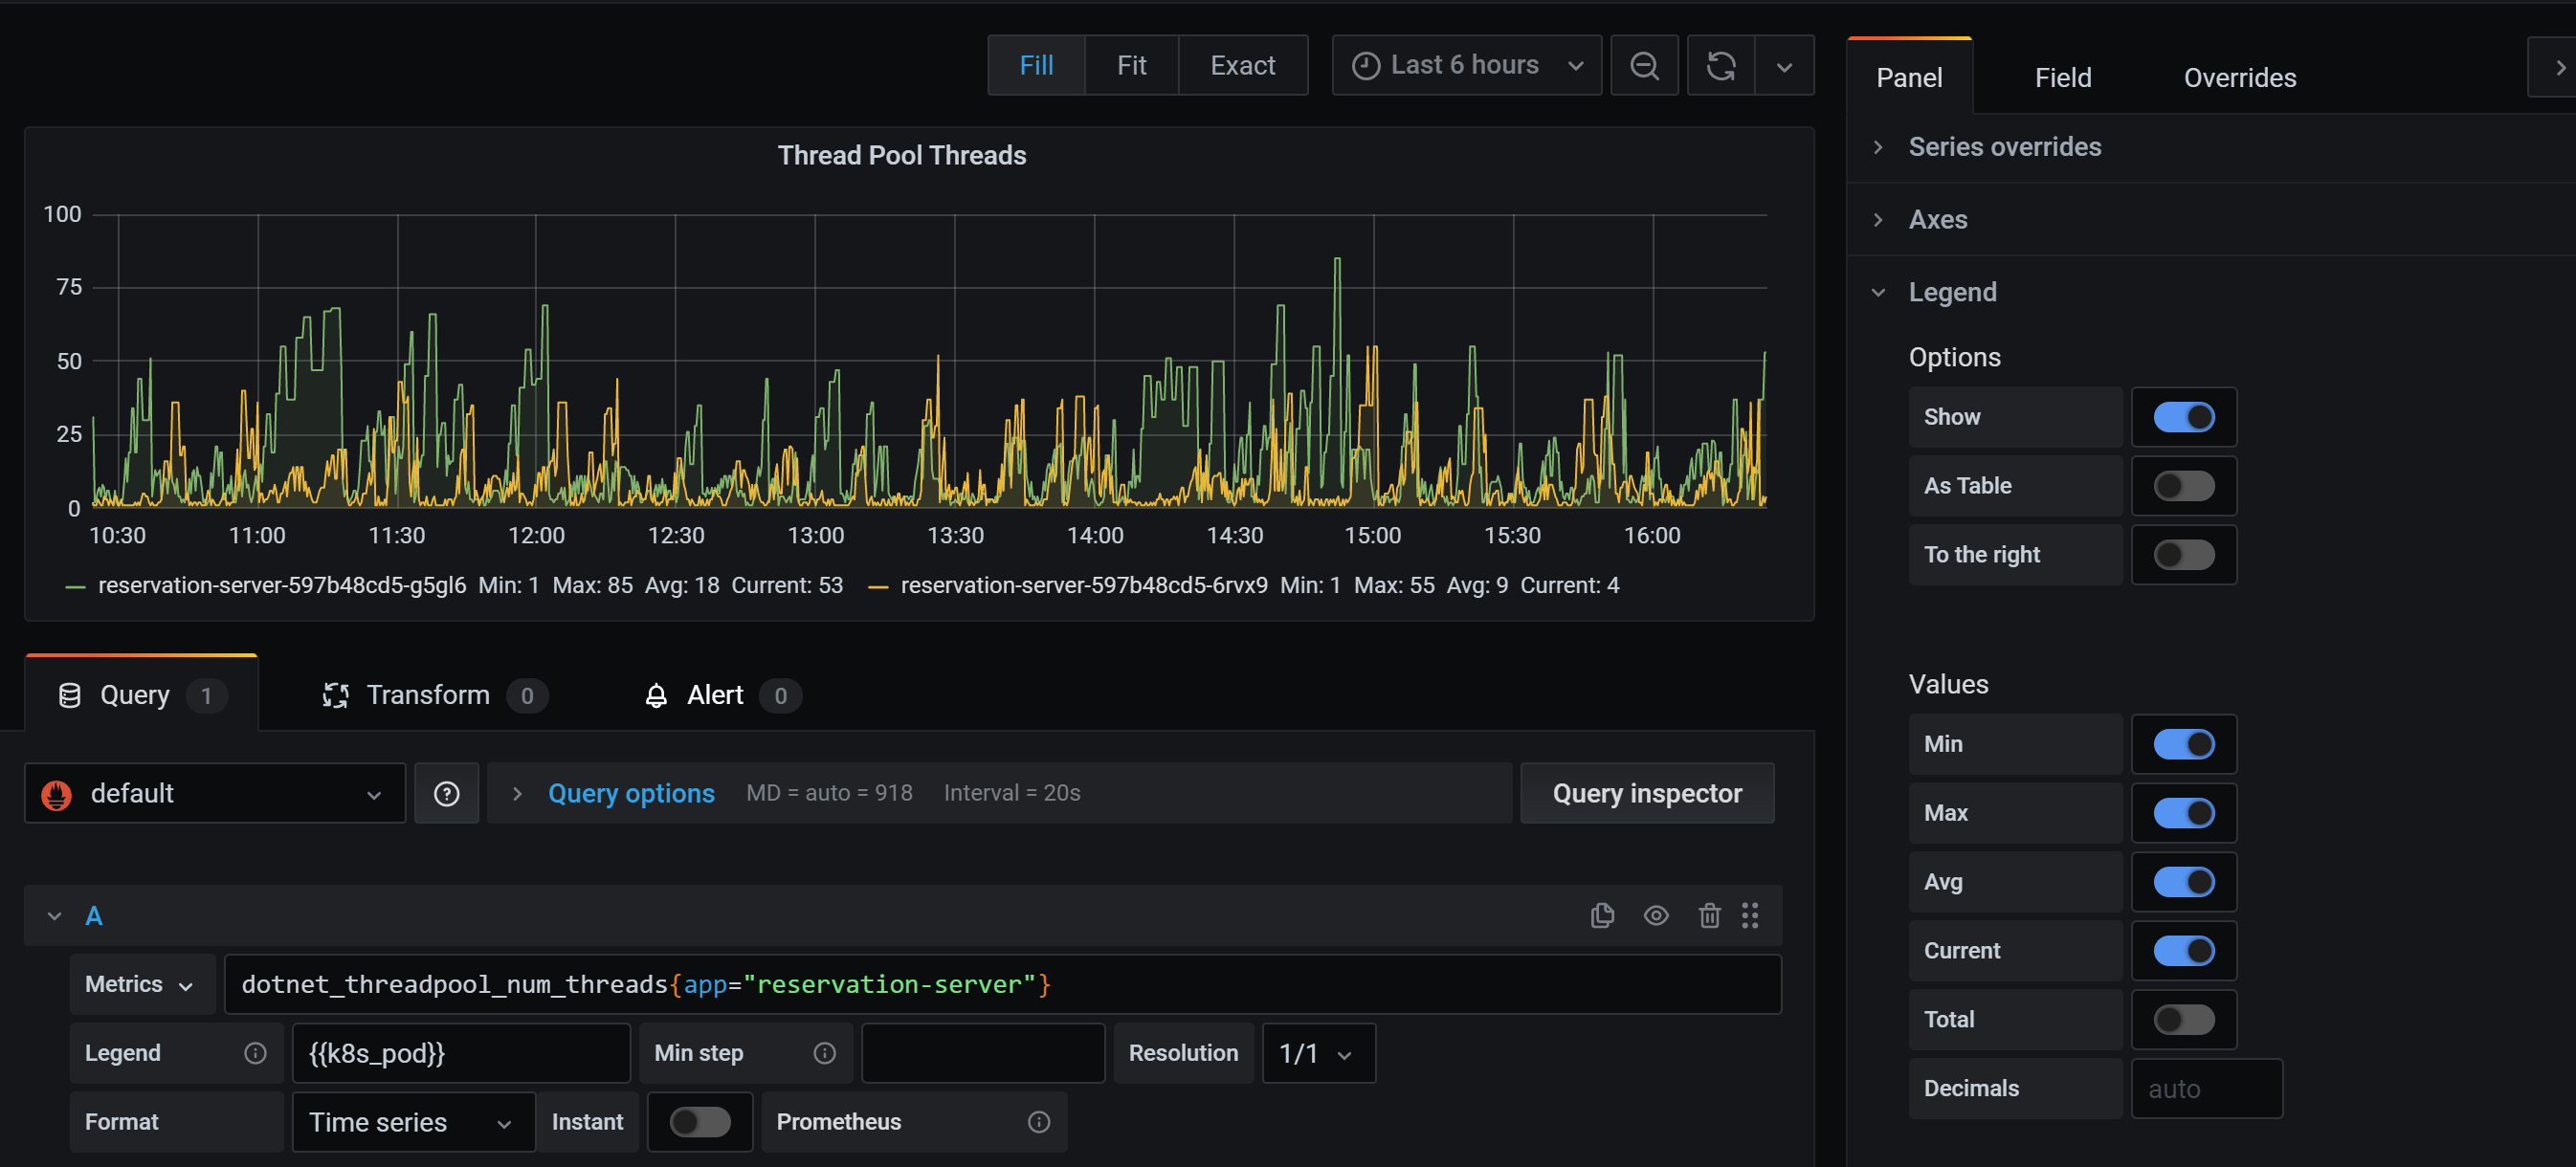
新建一个 Dashboard 把刚才的查询通过 Grafana 来做一个展示,新建一个 Panel,输入刚才我们执行的查询

Legend 中可以使用 lable,使用语法可以用 {{label_name}}
可以在右侧方便设置显示最小值,最大值,平均值,当前值和总计

如果要添加筛选条件如只看某一个 app 的数据,可以在查询表达式中添加条件,使用语法 metrics_name{label_name="label_value"}
更多查询语法可以参考官方文档的介绍 https://prometheus.io/docs/prometheus/latest/querying/basics/
More
上面部署的时候没有做数据的挂载,实际部署的时候需要考虑挂载数据目录,这样即使服务重启,数据还是在的,如果不关心数据问题的话可以忽略
Reference
- https://github.com/OpenReservation/ReservationServer/blob/dev/k8s/prometheus/deployment.yaml
- https://github.com/OpenReservation/ReservationServer/blob/dev/k8s/prometheus/configMap.yaml
- https://github.com/OpenReservation/ReservationServer/blob/dev/k8s/grafana/deployment.yaml
- https://github.com/OpenReservation/ReservationServer/blob/dev/k8s/grafana/service.yaml
- https://medium.com/kubernetes-tutorials/monitoring-your-kubernetes-deployments-with-prometheus-5665eda54045
- https://prometheus.io/docs/prometheus/latest/configuration/configuration
- https://prometheus.io/docs/prometheus/latest/querying/basics/
部署 Prometheus 和 Grafana 到 k8s的更多相关文章
- 【集群监控】Docker上部署Prometheus+Alertmanager+Grafana实现集群监控
Docker部署 下载 sudo yum-config-manager --add-repo https://download.docker.com/linux/centos/docker-ce.re ...
- kubernetes1.15极速部署prometheus和grafana
关于prometheus和grafana prometheus负责监控数据采集,grafana负责展示,下图来自官网: 环境信息 硬件:三台CentOS 7.7服务器 kubernetes:1.15 ...
- Kubernetes1.16下部署Prometheus+node-exporter+Grafana+AlertManager 监控系统
Prometheus 持久化安装 我们prometheus采用nfs挂载方式来存储数据,同时使用configMap管理配置文件.并且我们将所有的prometheus存储在kube-system #建议 ...
- K8s 部署 Prometheus + Grafana
一.简介 1. Prometheus 一款开源的监控&报警&时间序列数据库的组合,起始是由 SoundCloud 公司开发的 基本原理是通过 HTTP 协议周期性抓取被监控组件的状态, ...
- k8s实战之部署Prometheus+Grafana可视化监控告警平台
写在前面 之前部署web网站的时候,架构图中有一环节是监控部分,并且搭建一套有效的监控平台对于运维来说非常之重要,只有这样才能更有效率的保证我们的服务器和服务的稳定运行,常见的开源监控软件有好几种,如 ...
- 基于k8s集群部署prometheus监控ingress nginx
目录 基于k8s集群部署prometheus监控ingress nginx 1.背景和环境概述 2.修改prometheus配置 3.检查是否生效 4.配置grafana图形 基于k8s集群部署pro ...
- 基于k8s集群部署prometheus监控etcd
目录 基于k8s集群部署prometheus监控etcd 1.背景和环境概述 2.修改prometheus配置 3.检查是否生效 4.配置grafana图形 基于k8s集群部署prometheus监控 ...
- k8s之自定义指标API部署prometheus
1.自定义指标-prometheus node_exporter是agent;PromQL相当于sql语句来查询数据; k8s-prometheus-adapter:prometheus是不能直接解析 ...
- k8b部署prometheus+grafana
来源: https://juejin.im/post/5c36054251882525a50bbdf0 https://github.com/redhatxl/k8s-prometheus-grafa ...
随机推荐
- Ideas and Tricks Part II
33.对于统计答案幂次的技巧 对于$x^k$,考虑其组合意义:将$k$个不同球放到$x$个不同的盒子里的方案数,直接维护不好维护,那么考虑枚举把这些球放到了哪些盒子里,最后乘上第二类斯特林数和对于的阶 ...
- solr 文档一
[在此处输入文章标题] 参考博客: http://blog.csdn.net/matthewei6/article/details/50620600 基础环境搭建 solr版本5.5.5: 一.sol ...
- 1.使用javax.mail, spring的JavaMailSender,springboot发送邮件
一.java发邮件 电子邮件服务器:这些邮件服务器就类似于邮局,它主要负责接收用户投递过来的邮件,并把邮件投递到邮件接收者的电子邮箱中,按功能划分有两种类型 SMTP邮件服务器:用户替用户发送邮件和接 ...
- # Maven:Could not transfer artifact org.springframework:spring-webmvc:pom:。。。(系统找不到文件),从网上clone到本地的项目报红
解决办法: 确保maven配置正确,在maven的setting.xml配置文件中, 配置本地仓库路径 <localRepository>D:\Maven\文件名</localRep ...
- 为什么使用MongoDB
MongoDB vs MySQL Nosql vs RDBMS(关系型数据库) MongoDB采用类似Json的形式存储数据而不是结构性的表 MongoDB的分片机制支持海量数据的存储和扩展,并有完整 ...
- UNP——第三章,套接字编程介绍
1.套接字结构 多数套接字函数都有套接字结构参数,每个协议族都定义了自己的套接字结构,以 sockaddr_ 开始,并对应协议族的唯一后缀. struct sockaddr_in { uint8_t ...
- mysql三层体系
Mysql:是单进程多线程数据库. MySQL分层: mysql分三层:网络连接层, sql层, 存储引擎层,而网络连接层与sql层合称server层,故mysql又分server层合储存引擎层.第一 ...
- mysql_用命令行备份数据库
MySQL数据库使用命令行备份|MySQL数据库备份命令 例如: 数据库地址:127.0.0.1 数据库用户名:root 数据库密码:pass 数据库名称:myweb 备份数据库到D盘跟目录 mysq ...
- App安全常见漏洞修复建议
ios开发对自己的app做一系列的环境检测 检测Cydia是否安装 检测app是否可以编辑系统文件 检测系统是否包含可疑的文件 检测是否有可疑的app安装如:FakeCarrier, Icy, etc ...
- invalid PID number "" in "/usr/local/nginx/logs/nginx.pid"
解决办法: $ sudo nginx -c /usr/local/etc/nginx/nginx.conf $ sudo nginx -s reload