kubernetes生态--交付prometheus监控及grafana炫酷dashboard到k8s集群
由于docker容器的特殊性,传统的zabbix无法对k8s集群内的docker状态进行监控,所以需要使用prometheus来进行监控:
什么是Prometheus?
Prometheus是由SoundCloud开发的开源监控报警系统和时序列数据库(TSDB)。Prometheus使用Go语言开发,是Google BorgMon监控系统的开源版本。
2016年由Google发起Linux基金会旗下的原生云基金会(Cloud Native Computing Foundation), 将Prometheus纳入其下第二大开源项目。
Prometheus目前在开源社区相当活跃。
Prometheus和Heapster(Heapster是K8S的一个子项目,用于获取集群的性能数据。)相比功能更完善、更全面。Prometheus性能也足够支撑上万台规模的集群。
Prometheus的特点
- 多维度数据模型。
- 灵活的查询语言。
- 不依赖分布式存储,单个服务器节点是自主的。
- 通过基于HTTP的pull方式采集时序数据。
- 可以通过中间网关进行时序列数据推送。
- 通过服务发现或者静态配置来发现目标服务对象。
- 支持多种多样的图表和界面展示,比如Grafana等。
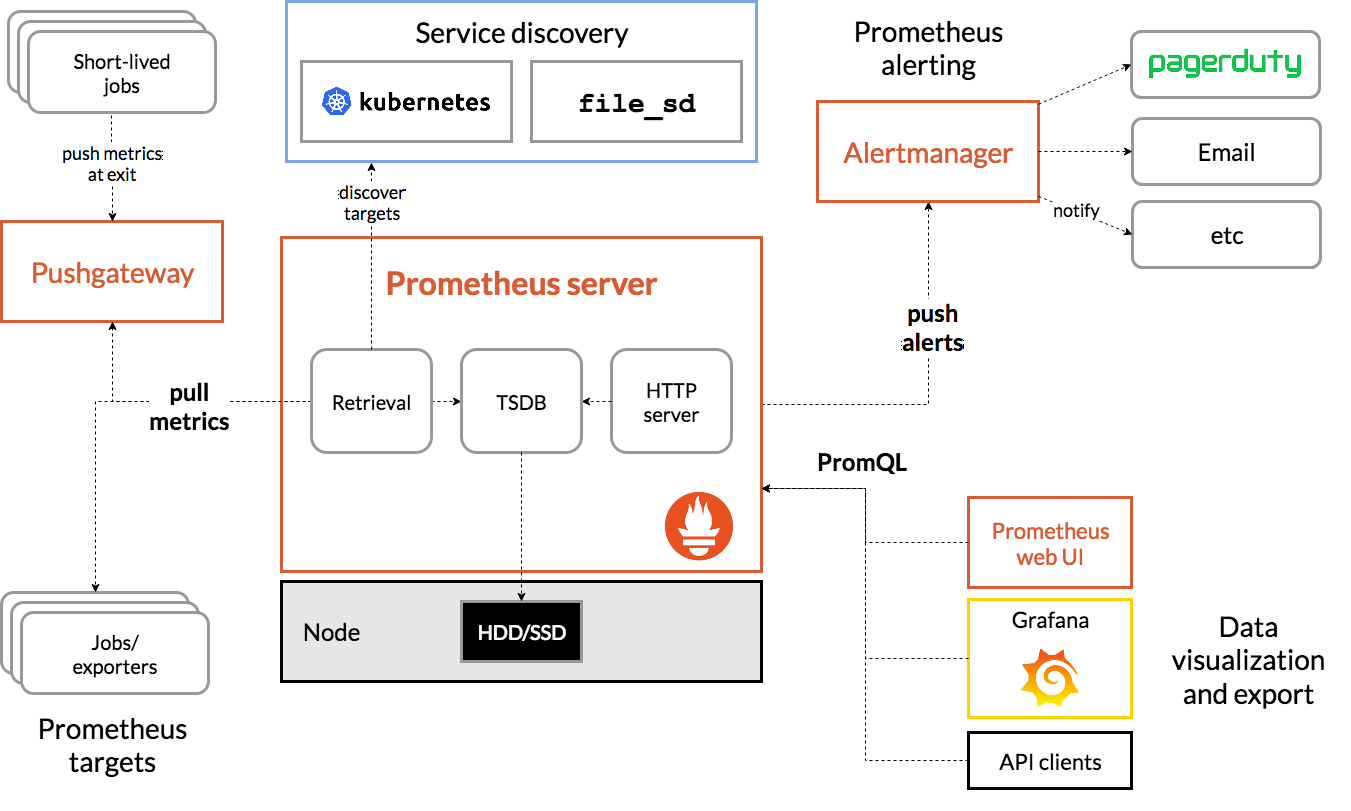
基本原理
Prometheus的基本原理是通过HTTP协议周期性抓取被监控组件的状态,任意组件只要提供对应的HTTP接口就可以接入监控。不需要任何SDK或者其他的集成过程。这样做非常适合做虚拟化环境监控系统,比如VM、Docker、Kubernetes等。输出被监控组件信息的HTTP接口被叫做exporter 。目前互联网公司常用的组件大部分都有exporter可以直接使用,比如Varnish、Haproxy、Nginx、MySQL、Linux系统信息(包括磁盘、内存、CPU、网络等等)。
服务过程
- Prometheus Daemon负责定时去目标上抓取metrics(指标)数据,每个抓取目标需要暴露一个http服务的接口给它定时抓取。Prometheus支持通过配置文件、文本文件、Zookeeper、Consul、DNS SRV Lookup等方式指定抓取目标。Prometheus采用PULL的方式进行监控,即服务器可以直接通过目标PULL数据或者间接地通过中间网关来Push数据。
- Prometheus在本地存储抓取的所有数据,并通过一定规则进行清理和整理数据,并把得到的结果存储到新的时间序列中。
- Prometheus通过PromQL和其他API可视化地展示收集的数据。Prometheus支持很多方式的图表可视化,例如Grafana、自带的Promdash以及自身提供的模版引擎等等。Prometheus还提供HTTP API的查询方式,自定义所需要的输出。
- PushGateway支持Client主动推送metrics到PushGateway,而Prometheus只是定时去Gateway上抓取数据。
- Alertmanager是独立于Prometheus的一个组件,可以支持Prometheus的查询语句,提供十分灵活的报警方式。
三大套件
- Server 主要负责数据采集和存储,提供PromQL查询语言的支持。
- Alertmanager 警告管理器,用来进行报警。
- Push Gateway 支持临时性Job主动推送指标的中间网关。
prometheus不同于zabbix,没有agent,使用的是针对不同服务的exporter:
prometheus官网:官网地址
正常情况下,监控k8s集群及node,pod,常用的exporter有四个:
- kube-state-metrics -- 收集k8s集群master&etcd等基本状态信息
- node-exporter -- 收集k8s集群node信息
- cadvisor -- 收集k8s集群docker容器内部使用资源信息
- blackbox-exporte -- 收集k8s集群docker容器服务是否存活
接下来逐一创建以上exporter:
老套路,下载docker镜像,准备资源配置清单,应用资源配置清单:
一、kube-state-metrics
# docker pull quay.io/coreos/kube-state-metrics:v1.5.0
# docker tag 91599517197a harbor.od.com/public/kube-state-metrics:v1.5.0

# docker push harbor.od.com/public/kube-state-metrics:v1.5.0
准备资源配置清单:
1、rbac.yaml
# mkdir /data/k8s-yaml/kube-state-metrics && cd /data/k8s-yaml/kube-state-metrics
apiVersion: v1

kind: ServiceAccount

metadata:

  labels:

    addonmanager.kubernetes.io/mode: Reconcile

    kubernetes.io/cluster-service: "true"

  name: kube-state-metrics

  namespace: kube-system

---

apiVersion: rbac.authorization.k8s.io/v1

kind: ClusterRole

metadata:

  labels:

    addonmanager.kubernetes.io/mode: Reconcile

    kubernetes.io/cluster-service: "true"

  name: kube-state-metrics

rules:

- apiGroups:

  - ""

  resources:

  - configmaps

  - secrets

  - nodes

  - pods

  - services

  - resourcequotas

  - replicationcontrollers

  - limitranges

  - persistentvolumeclaims

  - persistentvolumes

  - namespaces

  - endpoints

  verbs:

  - list

  - watch

- apiGroups:

  - policy

  resources:

  - poddisruptionbudgets

  verbs:

  - list

  - watch

- apiGroups:

  - extensions

  resources:

  - daemonsets

  - deployments

  - replicasets

  verbs:

  - list

  - watch

- apiGroups:

  - apps

  resources:

  - statefulsets

  verbs:

  - list

  - watch

- apiGroups:

  - batch

  resources:

  - cronjobs

  - jobs

  verbs:

  - list

  - watch

- apiGroups:

  - autoscaling

  resources:

  - horizontalpodautoscalers

  verbs:

  - list

  - watch

---

apiVersion: rbac.authorization.k8s.io/v1

kind: ClusterRoleBinding

metadata:

  labels:

    addonmanager.kubernetes.io/mode: Reconcile

    kubernetes.io/cluster-service: "true"

  name: kube-state-metrics

roleRef:

  apiGroup: rbac.authorization.k8s.io

  kind: ClusterRole

  name: kube-state-metrics

subjects:

- kind: ServiceAccount

  name: kube-state-metrics

  namespace: kube-system
2、dp.yaml
apiVersion: extensions/v1beta1

kind: Deployment

metadata:

  annotations:

    deployment.kubernetes.io/revision: "2"

  labels:

    grafanak8sapp: "true"

    app: kube-state-metrics

  name: kube-state-metrics

  namespace: kube-system

spec:

  selector:

    matchLabels:

      grafanak8sapp: "true"

      app: kube-state-metrics

  strategy:

    rollingUpdate:

      maxSurge: 25%

      maxUnavailable: 25%

    type: RollingUpdate

  template:

    metadata:

      labels:

        grafanak8sapp: "true"

        app: kube-state-metrics

    spec:

      containers:

      - name: kube-state-metrics

        image: harbor.od.com/public/kube-state-metrics:v1.5.0

        imagePullPolicy: IfNotPresent

        ports:

        - containerPort: 8080

          name: http-metrics

          protocol: TCP

        readinessProbe:

          failureThreshold: 3

          httpGet:

            path: /healthz

            port: 8080

            scheme: HTTP

          initialDelaySeconds: 5

          periodSeconds: 10

          successThreshold: 1

          timeoutSeconds: 5

      serviceAccountName: kube-state-metrics
应用资源配置清单:
# kubectl apply -f http://k8s-yaml.od.com/kube-state-metrics/rbac.yaml

# kubectl apply -f http://k8s-yaml.od.com/kube-state-metrics/dp.yaml
测试一下:
# kubectl get pod -n kube-system -o wide
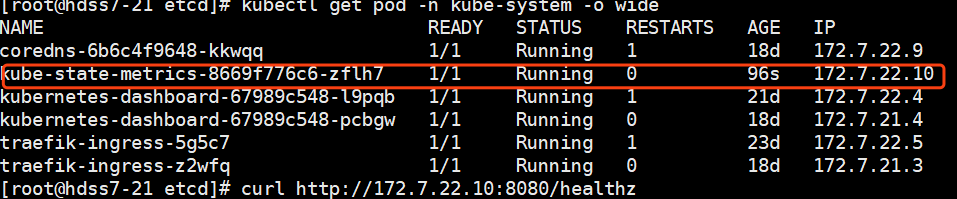
# curl http://172.7.22.10:8080/healthz

已经成功运行。
二、node-exporter
由于node-exporter是监控node的,所有需要每个节点启动一个,所以使用ds控制器
# docker pull prom/node-exporter:v0.15.0
# docker tag 12d51ffa2b22 harbor.od.com/public/node-exporter:v0.15.0

# docker push harbor.od.com/public/node-exporter:v0.15.0
准备资源配置清单:
1、ds.yaml
# mkdir node-exporter && cd node-exporter
kind: DaemonSet

apiVersion: extensions/v1beta1

metadata:

  name: node-exporter

  namespace: kube-system

  labels:

    daemon: "node-exporter"

    grafanak8sapp: "true"

spec:

  selector:

    matchLabels:

      daemon: "node-exporter"

      grafanak8sapp: "true"

  template:

    metadata:

      name: node-exporter

      labels:

        daemon: "node-exporter"

        grafanak8sapp: "true"

    spec:

      volumes:

      - name: proc

        hostPath:

          path: /proc

          type: ""

      - name: sys

        hostPath:

          path: /sys

          type: ""

      containers:

      - name: node-exporter

        image: harbor.od.com/public/node-exporter:v0.15.0

        imagePullPolicy: IfNotPresent

        args:

        - --path.procfs=/host_proc

        - --path.sysfs=/host_sys

        ports:

        - name: node-exporter

          hostPort: 9100

          containerPort: 9100

          protocol: TCP

        volumeMounts:

        - name: sys

          readOnly: true

          mountPath: /host_sys

        - name: proc

          readOnly: true

          mountPath: /host_proc

      hostNetwork: true
应用资源配置清单:
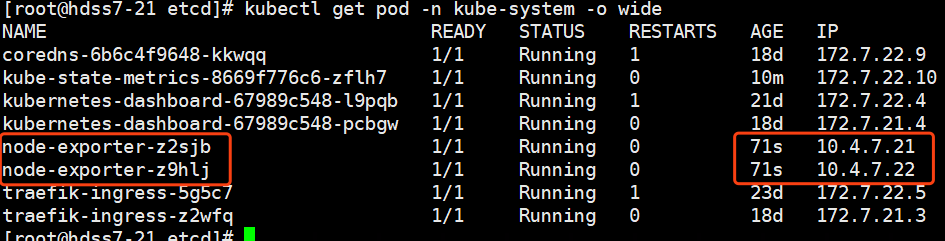
# kubectl apply -f http://k8s-yaml.od.com/node-exporter/ds.yaml
# kubectl get pod -n kube-system -o wide
我们有两个node,每个node节点启动一个:
三、cadvisor
# docker pull google/cadvisor:v0.28.3
# docker tag 75f88e3ec333 harbor.od.com/public/cadvisor:0.28.3
# docker push harbor.od.com/public/cadvisor:0.28.3
准备资源配置清单:
# mkdir cadvisor && cd cadvisor
1、ds.yaml 标红部分是k8s资源配置清单中一个重要的高级属性,下一篇博客着重介绍
apiVersion: apps/v1

kind: DaemonSet

metadata:

  name: cadvisor

  namespace: kube-system

  labels:

    app: cadvisor

spec:

  selector:

    matchLabels:

      name: cadvisor

  template:

    metadata:

      labels:

        name: cadvisor

    spec:

      hostNetwork: true

      tolerations:

      - key: node-role.kubernetes.io/master

        effect: NoSchedule

      containers:

      - name: cadvisor

        image: harbor.od.com/public/cadvisor:v0.28.3

        imagePullPolicy: IfNotPresent

        volumeMounts:

        - name: rootfs

          mountPath: /rootfs

          readOnly: true

        - name: var-run

          mountPath: /var/run

        - name: sys

          mountPath: /sys

          readOnly: true

        - name: docker

          mountPath: /var/lib/docker

          readOnly: true

        ports:

          - name: http

            containerPort: 4194

            protocol: TCP

        readinessProbe:

          tcpSocket:

            port: 4194

          initialDelaySeconds: 5

          periodSeconds: 10

        args:

          - --housekeeping_interval=10s

          - --port=4194

      terminationGracePeriodSeconds: 30

      volumes:

      - name: rootfs

        hostPath:

          path: /

      - name: var-run

        hostPath:

          path: /var/run

      - name: sys

        hostPath:

          path: /sys

      - name: docker

        hostPath:

          path: /data/docker
针对挂载资源,做一些调整:
# mount -o remount,rw /sys/fs/cgroup/

# ln -s /sys/fs/cgroup/cpu,cpuacct /sys/fs/cgroup/cpuacct,cpu
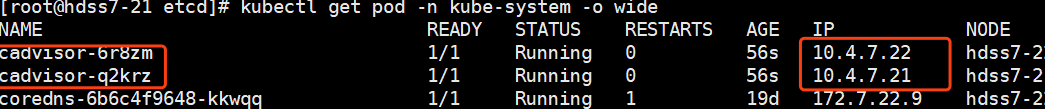
应用资源配置清单:
# kubectl apply -f http://k8s-yaml.od.com/cadvisor/ds.yaml
检查:
四、blackbox-exporter
# docker pull prom/blackbox-exporter:v0.15.1
# docker tag 81b70b6158be  harbor.od.com/public/blackbox-exporter:v0.15.1

# docker push harbor.od.com/public/blackbox-exporter:v0.15.1
创建资源配置清单:
1、cm.yaml
apiVersion: v1

kind: ConfigMap

metadata:

  labels:

    app: blackbox-exporter

  name: blackbox-exporter

  namespace: kube-system

data:

  blackbox.yml: |-

    modules:

      http_2xx:

        prober: http

        timeout: 2s

        http:

          valid_http_versions: ["HTTP/1.1", "HTTP/2"]

          valid_status_codes: [200,301,302]

          method: GET

          preferred_ip_protocol: "ip4"

      tcp_connect:

        prober: tcp

        timeout: 2s
2、dp.yaml
kind: Deployment

apiVersion: extensions/v1beta1

metadata:

  name: blackbox-exporter

  namespace: kube-system

  labels:

    app: blackbox-exporter

  annotations:

    deployment.kubernetes.io/revision: 1

spec:

  replicas: 1

  selector:

    matchLabels:

      app: blackbox-exporter

  template:

    metadata:

      labels:

        app: blackbox-exporter

    spec:

      volumes:

      - name: config

        configMap:

          name: blackbox-exporter

          defaultMode: 420

      containers:

      - name: blackbox-exporter

        image: harbor.od.com/public/blackbox-exporter:v0.15.1

        imagePullPolicy: IfNotPresent

        args:

        - --config.file=/etc/blackbox_exporter/blackbox.yml

        - --log.level=info

        - --web.listen-address=:9115

        ports:

        - name: blackbox-port

          containerPort: 9115

          protocol: TCP

        resources:

          limits:

            cpu: 200m

            memory: 256Mi

          requests:

            cpu: 100m

            memory: 50Mi

        volumeMounts:

        - name: config

          mountPath: /etc/blackbox_exporter

        readinessProbe:

          tcpSocket:

            port: 9115

          initialDelaySeconds: 5

          timeoutSeconds: 5

          periodSeconds: 10

          successThreshold: 1

          failureThreshold: 3
3、svc.yaml
kind: Service

apiVersion: v1

metadata:

  name: blackbox-exporter

  namespace: kube-system

spec:

  selector:

    app: blackbox-exporter

  ports:

    - name: blackbox-port

      protocol: TCP

      port: 9115
4、ingress.yaml
apiVersion: extensions/v1beta1

kind: Ingress

metadata:

  name: blackbox-exporter

  namespace: kube-system

spec:

  rules:

  - host: blackbox.od.com

    http:

      paths:

      - path: /

        backend:

          serviceName: blackbox-exporter

          servicePort: blackbox-port
这里用到了一个域名,添加解析:
# vi /var/named/od.com.zone
blackbox A 10.4.7.10
应用资源配置清单:
# kubectl apply -f http://k8s-yaml.od.com/blackbox-exporter/cm.yaml

# kubectl apply -f http://k8s-yaml.od.com/blackbox-exporter/dp.yaml

# kubectl apply -f http://k8s-yaml.od.com/blackbox-exporter/svc.yaml

# kubectl apply -f http://k8s-yaml.od.com/blackbox-exporter/ingress.yaml

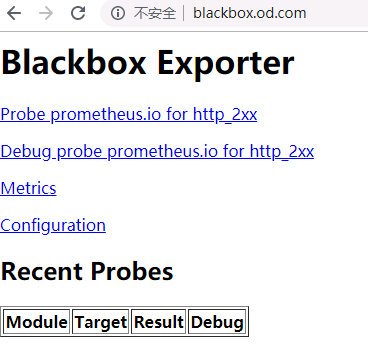
访问域名测试:
访问到以下界面,表示blackbox已经运行成功
接下来部署prometheus server:
# docker pull prom/prometheus:v2.14.0
# docker tag 7317640d555e harbor.od.com/infra/prometheus:v2.14.0

# docker push harbor.od.com/infra/prometheus:v2.14.0
准备资源配置清单:
1、rbac.yaml
apiVersion: v1

kind: ServiceAccount

metadata:

  labels:

    addonmanager.kubernetes.io/mode: Reconcile

    kubernetes.io/cluster-service: "true"

  name: prometheus

  namespace: infra

---

apiVersion: rbac.authorization.k8s.io/v1

kind: ClusterRole

metadata:

  labels:

    addonmanager.kubernetes.io/mode: Reconcile

    kubernetes.io/cluster-service: "true"

  name: prometheus

rules:

- apiGroups:

  - ""

  resources:

  - nodes

  - nodes/metrics

  - services

  - endpoints

  - pods

  verbs:

  - get

  - list

  - watch

- apiGroups:

  - ""

  resources:

  - configmaps

  verbs:

  - get

- nonResourceURLs:

  - /metrics

  verbs:

  - get

---

apiVersion: rbac.authorization.k8s.io/v1

kind: ClusterRoleBinding

metadata:

  labels:

    addonmanager.kubernetes.io/mode: Reconcile

    kubernetes.io/cluster-service: "true"

  name: prometheus

roleRef:

  apiGroup: rbac.authorization.k8s.io

  kind: ClusterRole

  name: prometheus

subjects:

- kind: ServiceAccount

  name: prometheus

  namespace: infra
2、dp.yaml
加上--web.enable-lifecycle启用远程热加载配置文件
调用指令是curl -X POST http://localhost:9090/-/reload
storage.tsdb.min-block-duration=10m #只加载10分钟数据到内
storage.tsdb.retention=72h #保留72小时数据
apiVersion: extensions/v1beta1

kind: Deployment

metadata:

  annotations:

    deployment.kubernetes.io/revision: "5"

  labels:

    name: prometheus

  name: prometheus

  namespace: infra

spec:

  progressDeadlineSeconds: 600

  replicas: 1

  revisionHistoryLimit: 7

  selector:

    matchLabels:

      app: prometheus

  strategy:

    rollingUpdate:

      maxSurge: 1

      maxUnavailable: 1

    type: RollingUpdate

  template:

    metadata:

      labels:

        app: prometheus

    spec:

      containers:

      - name: prometheus

        image: harbor.od.com/infra/prometheus:v2.14.0

        imagePullPolicy: IfNotPresent

        command:

        - /bin/prometheus

        args:

        - --config.file=/data/etc/prometheus.yml

        - --storage.tsdb.path=/data/prom-db

        - --storage.tsdb.min-block-duration=10m

        - --storage.tsdb.retention=72h

        - --web.enable-lifecycle

        ports:

        - containerPort: 9090

          protocol: TCP

        volumeMounts:

        - mountPath: /data

          name: data

        resources:

          requests:

            cpu: "1000m"

            memory: "1.5Gi"

          limits:

            cpu: "2000m"

            memory: "3Gi"

      imagePullSecrets:

      - name: harbor

      securityContext:

        runAsUser: 0

      serviceAccountName: prometheus

      volumes:

      - name: data

        nfs:

          server: hdss7-200

          path: /data/nfs-volume/prometheus
3、svc.yaml
apiVersion: v1

kind: Service

metadata:

  name: prometheus

  namespace: infra

spec:

  ports:

  - port: 9090

    protocol: TCP

    targetPort: 9090

  selector:

    app: prometheus
4、ingress.yaml
apiVersion: extensions/v1beta1

kind: Ingress

metadata:

  annotations:

    kubernetes.io/ingress.class: traefik

  name: prometheus

  namespace: infra

spec:

  rules:

  - host: prometheus.od.com

    http:

      paths:

      - path: /

        backend:

          serviceName: prometheus

          servicePort: 9090
这里用到一个域名,添加解析:
prometheus A 10.4.7.10
记得重启named服务
创建需要的目录:
# mkdir -p /data/nfs-volume/prometheus/{etc,prom-db}
修改prometheus配置文件:别问为啥这么写,问就是不懂~
# vi /data/nfs-volume/prometheus/etc/prometheus.yml
global:
scrape_interval: 15s
evaluation_interval: 15s
scrape_configs:
- job_name: 'etcd'
tls_config:
ca_file: /data/etc/ca.pem
cert_file: /data/etc/client.pem
key_file: /data/etc/client-key.pem
scheme: https
static_configs:
- targets:
- '10.4.7.12:2379'
- '10.4.7.21:2379'
- '10.4.7.22:2379'
- job_name: 'kubernetes-apiservers'
kubernetes_sd_configs:
- role: endpoints
scheme: https
tls_config:
ca_file: /var/run/secrets/kubernetes.io/serviceaccount/ca.crt
bearer_token_file: /var/run/secrets/kubernetes.io/serviceaccount/token
relabel_configs:
- source_labels: [__meta_kubernetes_namespace, __meta_kubernetes_service_name, __meta_kubernetes_endpoint_port_name]
action: keep
regex: default;kubernetes;https
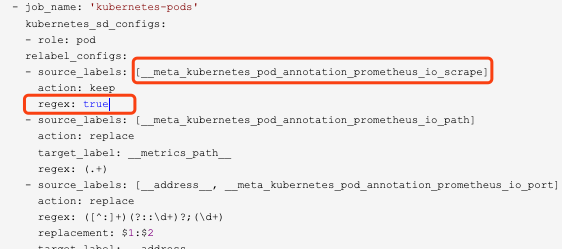
- job_name: 'kubernetes-pods'
kubernetes_sd_configs:
- role: pod
relabel_configs:
- source_labels: [__meta_kubernetes_pod_annotation_prometheus_io_scrape]
action: keep
regex: true
- source_labels: [__meta_kubernetes_pod_annotation_prometheus_io_path]
action: replace
target_label: __metrics_path__
regex: (.+)
- source_labels: [__address__, __meta_kubernetes_pod_annotation_prometheus_io_port]
action: replace
regex: ([^:]+)(?::\d+)?;(\d+)
replacement: $1:$2
target_label: __address__
- action: labelmap
regex: __meta_kubernetes_pod_label_(.+)
- source_labels: [__meta_kubernetes_namespace]
action: replace
target_label: kubernetes_namespace
- source_labels: [__meta_kubernetes_pod_name]
action: replace
target_label: kubernetes_pod_name
- job_name: 'kubernetes-kubelet'
kubernetes_sd_configs:
- role: node
relabel_configs:
- action: labelmap
regex: __meta_kubernetes_node_label_(.+)
- source_labels: [__meta_kubernetes_node_name]
regex: (.+)
target_label: __address__
replacement: ${1}:10255
- job_name: 'kubernetes-cadvisor'
kubernetes_sd_configs:
- role: node
relabel_configs:
- action: labelmap
regex: __meta_kubernetes_node_label_(.+)
- source_labels: [__meta_kubernetes_node_name]
regex: (.+)
target_label: __address__
replacement: ${1}:4194
- job_name: 'kubernetes-kube-state'
kubernetes_sd_configs:
- role: pod
relabel_configs:
- action: labelmap
regex: __meta_kubernetes_pod_label_(.+)
- source_labels: [__meta_kubernetes_namespace]
action: replace
target_label: kubernetes_namespace
- source_labels: [__meta_kubernetes_pod_name]
action: replace
target_label: kubernetes_pod_name
- source_labels: [__meta_kubernetes_pod_label_grafanak8sapp]
regex: .*true.*
action: keep
- source_labels: ['__meta_kubernetes_pod_label_daemon', '__meta_kubernetes_pod_node_name']
regex: 'node-exporter;(.*)'
action: replace
target_label: nodename
- job_name: 'blackbox_http_pod_probe'
metrics_path: /probe
kubernetes_sd_configs:
- role: pod
params:
module: [http_2xx]
relabel_configs:
- source_labels: [__meta_kubernetes_pod_annotation_blackbox_scheme]
action: keep
regex: http
- source_labels: [__address__, __meta_kubernetes_pod_annotation_blackbox_port, __meta_kubernetes_pod_annotation_blackbox_path]
action: replace
regex: ([^:]+)(?::\d+)?;(\d+);(.+)
replacement: $1:$2$3
target_label: __param_target
- action: replace
target_label: __address__
replacement: blackbox-exporter.kube-system:9115
- source_labels: [__param_target]
target_label: instance
- action: labelmap
regex: __meta_kubernetes_pod_label_(.+)
- source_labels: [__meta_kubernetes_namespace]
action: replace
target_label: kubernetes_namespace
- source_labels: [__meta_kubernetes_pod_name]
action: replace
target_label: kubernetes_pod_name
- job_name: 'blackbox_tcp_pod_probe'
metrics_path: /probe
kubernetes_sd_configs:
- role: pod
params:
module: [tcp_connect]
relabel_configs:
- source_labels: [__meta_kubernetes_pod_annotation_blackbox_scheme]
action: keep
regex: tcp
- source_labels: [__address__, __meta_kubernetes_pod_annotation_blackbox_port]
action: replace
regex: ([^:]+)(?::\d+)?;(\d+)
replacement: $1:$2
target_label: __param_target
- action: replace
target_label: __address__
replacement: blackbox-exporter.kube-system:9115
- source_labels: [__param_target]
target_label: instance
- action: labelmap
regex: __meta_kubernetes_pod_label_(.+)
- source_labels: [__meta_kubernetes_namespace]
action: replace
target_label: kubernetes_namespace
- source_labels: [__meta_kubernetes_pod_name]
action: replace
target_label: kubernetes_pod_name
- job_name: 'traefik'
kubernetes_sd_configs:
- role: pod
relabel_configs:
- source_labels: [__meta_kubernetes_pod_annotation_prometheus_io_scheme]
action: keep
regex: traefik
- source_labels: [__meta_kubernetes_pod_annotation_prometheus_io_path]
action: replace
target_label: __metrics_path__
regex: (.+)
- source_labels: [__address__, __meta_kubernetes_pod_annotation_prometheus_io_port]
action: replace
regex: ([^:]+)(?::\d+)?;(\d+)
replacement: $1:$2
target_label: __address__
- action: labelmap
regex: __meta_kubernetes_pod_label_(.+)
- source_labels: [__meta_kubernetes_namespace]
action: replace
target_label: kubernetes_namespace
- source_labels: [__meta_kubernetes_pod_name]
action: replace
target_label: kubernetes_pod_name
拷贝配置文件中用到的证书:
# cd /data/nfs-volume/prometheus/etc/
# cp /opt/certs/ca.pem ./

# cp /opt/certs/client.pem ./

# cp /opt/certs/client-key.pem ./
应用资源配置清单:
# kubectl apply -f http://k8s-yaml.od.com/prometheus-server/rbac.yaml

# kubectl apply -f http://k8s-yaml.od.com/prometheus-server/dp.yaml

# kubectl apply -f http://k8s-yaml.od.com/prometheus-server/svc.yaml

# kubectl apply -f http://k8s-yaml.od.com/prometheus-server/ingress.yaml

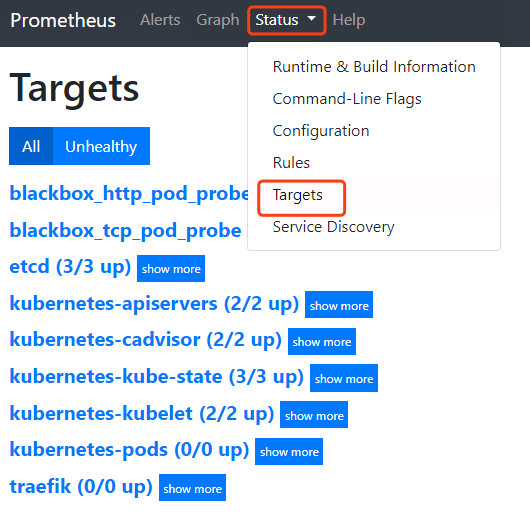
浏览器验证:prometheus.od.com
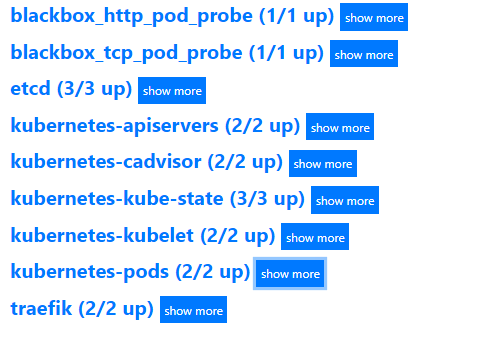
这里点击status-targets,这里展示的就是我们在prometheus.yml中配置的job-name,这些targets基本可以满足我们收集数据的需求。
点击status-configuration就是我们的配置文件
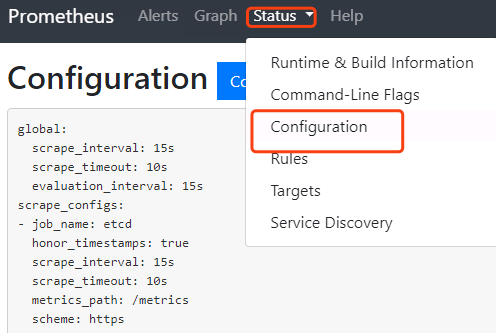
我们在配置文件中,除了etcd使用的静态配置以外,其他job都是使用的自动发现。
静态配置:
global:

  scrape_interval:     15s

  evaluation_interval: 15s

scrape_configs:

- job_name: 'etcd'

  tls_config:

    ca_file: /data/etc/ca.pem

    cert_file: /data/etc/client.pem

    key_file: /data/etc/client-key.pem

  scheme: https

  static_configs:

  - targets:

    - '10.4.7.12:2379'

    - '10.4.7.21:2379'

    - '10.4.7.22:2379'
自动发现:自动发现资源是pod
- job_name: 'blackbox_http_pod_probe'

  metrics_path: /probe

  kubernetes_sd_configs:

  - role: pod

  params:

    module: [http_2xx]

  relabel_configs:
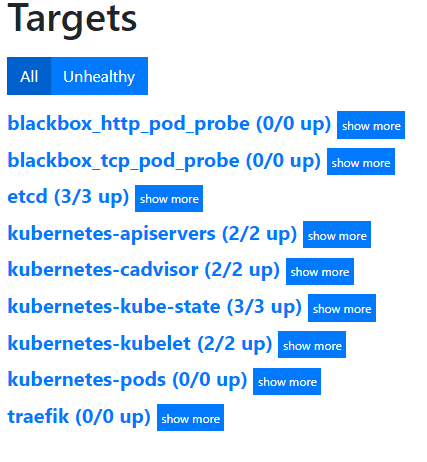
这里还有很多数据没有收集到,是因为我们在启动服务的时候,没有添加annotations,下面给需要收集数据的服务添加annotations
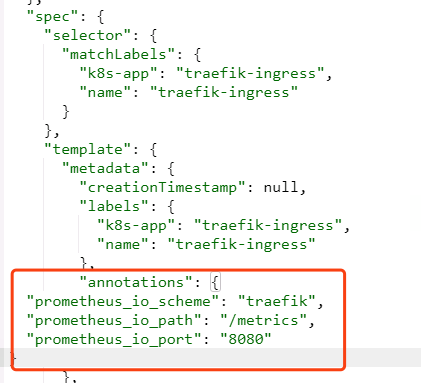
1、traefik:
修改traefik的yaml:
从dashboard里找到traefik的yaml,跟labels同级添加annotations
"annotations": {

  "prometheus_io_scheme": "traefik",

  "prometheus_io_path": "/metrics",

  "prometheus_io_port": "8080"

}
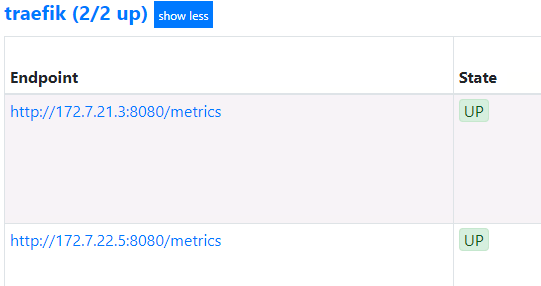
等待pod重启以后,在去prometheus上去看
2、blackbox:
这个是检测容器内服务存活性的,也就是端口健康状态检查,分为tcp和http
首先准备两个服务,将dubbo-demo-service和dubbo-demo-consumer都调整为使用master镜像,不依赖apollo的(节省资源)
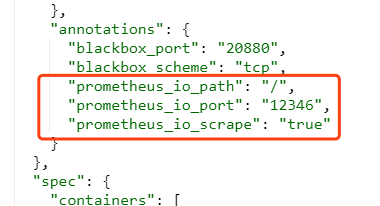
等两个服务起来以后,首先在dubbo-demo-service资源中添加一个TCP的annotation:
"annotations": {

  "blackbox_port": "20880",

  "blackbox_scheme": "tcp"

}
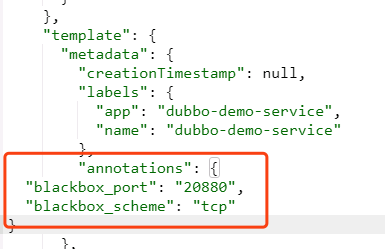
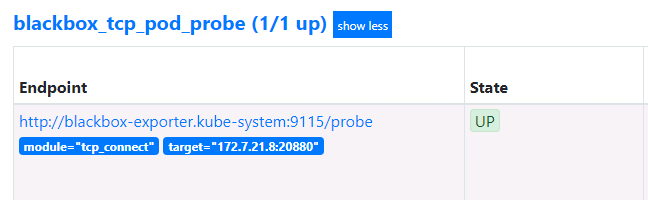
这里会自动发现我们服务中,运行tcp port端口为20880的服务,并监控其状态
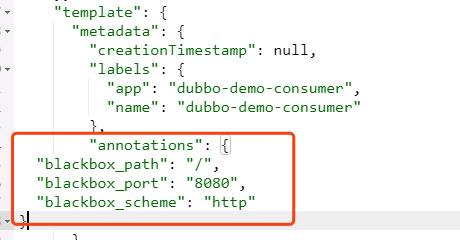
接下来在dubbo-demo-consumer资源中添加一个HTTP的annotation:
"annotations": {

  "blackbox_path": "/hello?name=health",

  "blackbox_port": "8080",

  "blackbox_scheme": "http"

}
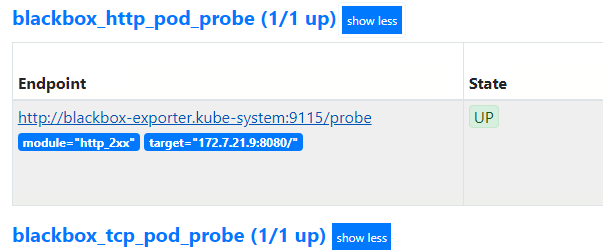
去检查blackbox.od.com
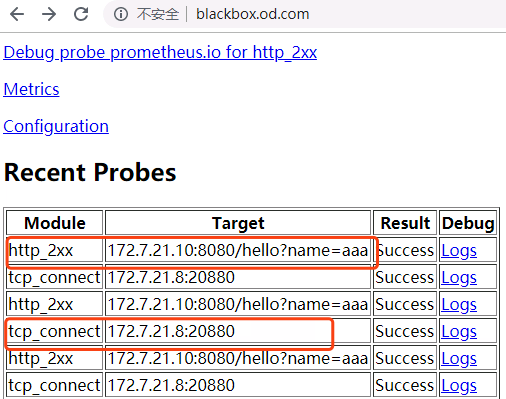
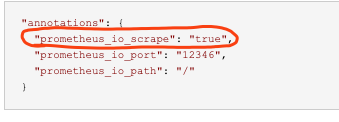
接下来添加监控jvm信息的annotation:
"annotations": {

  "prometheus_io_scrape": "true",

  "prometheus_io_port": "12346",

  "prometheus_io_path": "/"

}
dubbo-demo-service和dubbo-demo-consumer都添加:
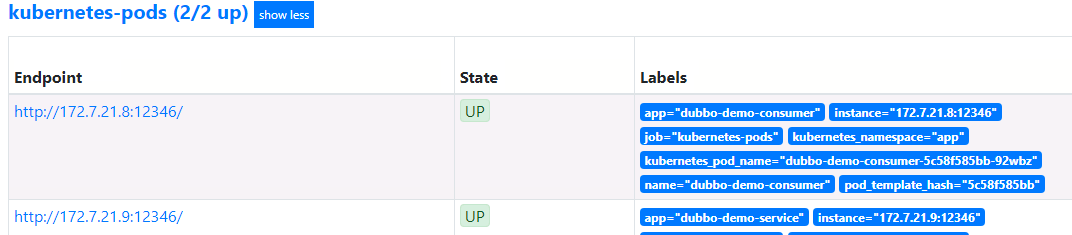
匹配规则,要去prometheus.yml中去看。
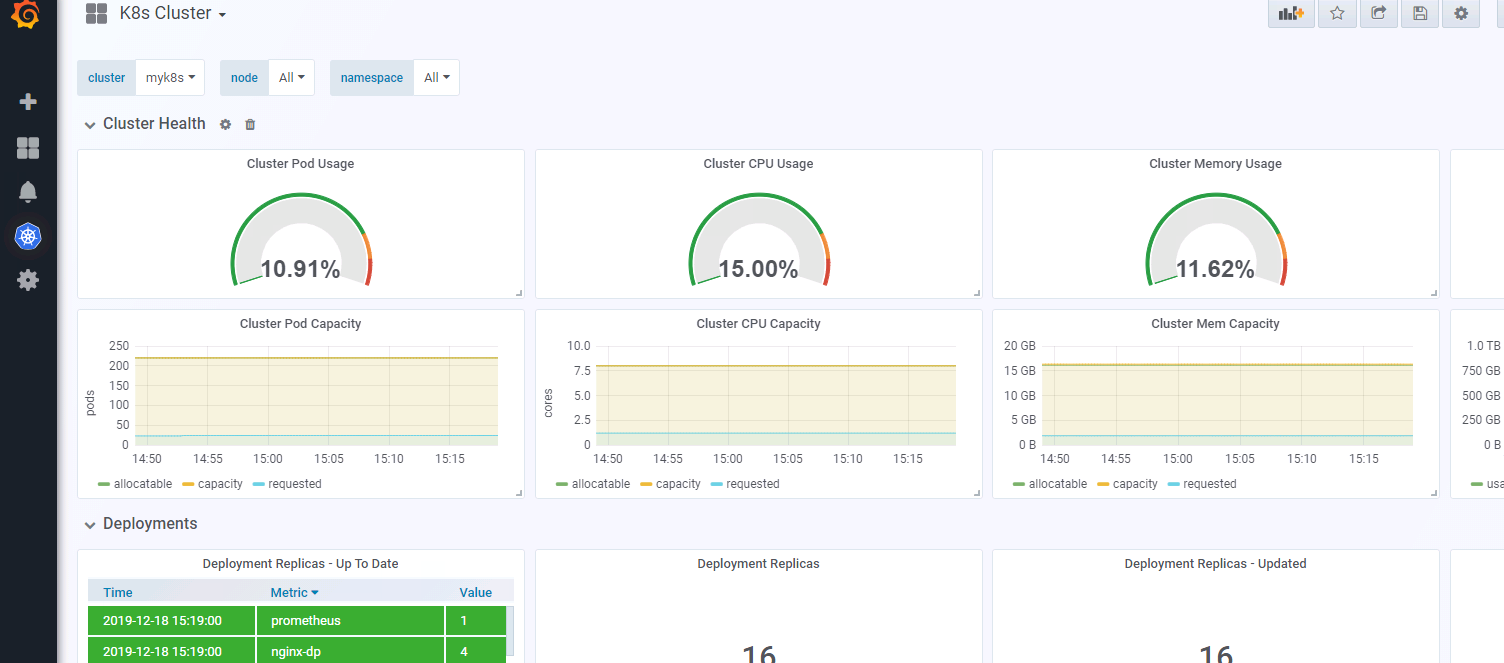
接下来部署炫酷的dashboard工具grafana:
下载镜像:
# docker pull grafana/grafana:5.4.2
# docker tag 6f18ddf9e552 harbor.od.com/infra/grafana:v5.4.2
# docker push harbor.od.com/infra/grafana:v5.4.2
准备资源配置清单:
1、rbac.yaml
apiVersion: rbac.authorization.k8s.io/v1

kind: ClusterRole

metadata:

  labels:

    addonmanager.kubernetes.io/mode: Reconcile

    kubernetes.io/cluster-service: "true"

  name: grafana

rules:

- apiGroups:

  - "*"

  resources:

  - namespaces

  - deployments

  - pods

  verbs:

  - get

  - list

  - watch

---

apiVersion: rbac.authorization.k8s.io/v1

kind: ClusterRoleBinding

metadata:

  labels:

    addonmanager.kubernetes.io/mode: Reconcile

    kubernetes.io/cluster-service: "true"

  name: grafana

roleRef:

  apiGroup: rbac.authorization.k8s.io

  kind: ClusterRole

  name: grafana

subjects:

- kind: User

  name: k8s-node
2、dp.yaml
apiVersion: extensions/v1beta1

kind: Deployment

metadata:

  labels:

    app: grafana

    name: grafana

  name: grafana

  namespace: infra

spec:

  progressDeadlineSeconds: 600

  replicas: 1

  revisionHistoryLimit: 7

  selector:

    matchLabels:

      name: grafana

  strategy:

    rollingUpdate:

      maxSurge: 1

      maxUnavailable: 1

    type: RollingUpdate

  template:

    metadata:

      labels:

        app: grafana

        name: grafana

    spec:

      containers:

      - name: grafana

        image: harbor.od.com/infra/grafana:v5.4.2

        imagePullPolicy: IfNotPresent

        ports:

        - containerPort: 3000

          protocol: TCP

        volumeMounts:

        - mountPath: /var/lib/grafana

          name: data

      imagePullSecrets:

      - name: harbor

      securityContext:

        runAsUser: 0

      volumes:

      - nfs:

          server: hdss7-200

          path: /data/nfs-volume/grafana

        name: data
# mkdir /data/nfs-volume/grafana
3、svc.yaml
apiVersion: v1

kind: Service

metadata:

  name: grafana

  namespace: infra

spec:

  ports:

  - port: 3000

    protocol: TCP

    targetPort: 3000

  selector:

    app: grafana
4、ingress.yaml
apiVersion: extensions/v1beta1

kind: Ingress

metadata:

  name: grafana

  namespace: infra

spec:

  rules:

  - host: grafana.od.com

    http:

      paths:

      - path: /

        backend:

          serviceName: grafana

          servicePort: 3000
域名解析:
grafana A 10.4.7.10
应用资源配置清单:
# kubectl apply -f http://k8s-yaml.od.com/grafana/rbac.yaml

# kubectl apply -f http://k8s-yaml.od.com/grafana/dp.yaml

# kubectl apply -f http://k8s-yaml.od.com/grafana/svc.yaml

# kubectl apply -f http://k8s-yaml.od.com/grafana/ingress.yaml
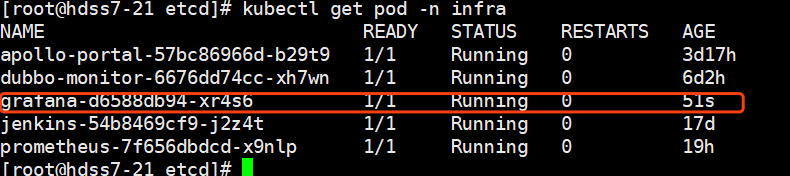
浏览器访问验证:
grafana.od.com
默认用户名密码admin
进入容器安装插件:
# kubectl exec -it grafana-d6588db94-xr4s6 /bin/bash -n infra
grafana-cli plugins install grafana-kubernetes-app

grafana-cli plugins install grafana-clock-panel

grafana-cli plugins install grafana-piechart-panel

grafana-cli plugins install briangann-gauge-panel

grafana-cli plugins install natel-discrete-panel
配置数据源:选择prometheus,把三个证书添加进来
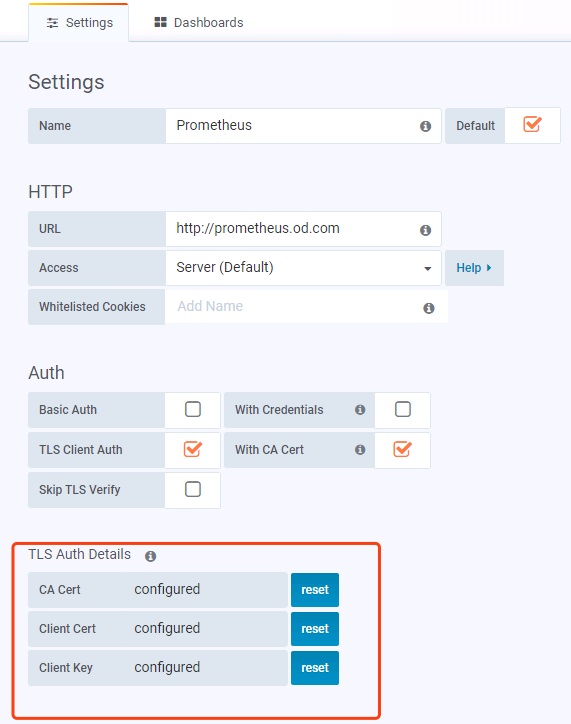
重启grafana
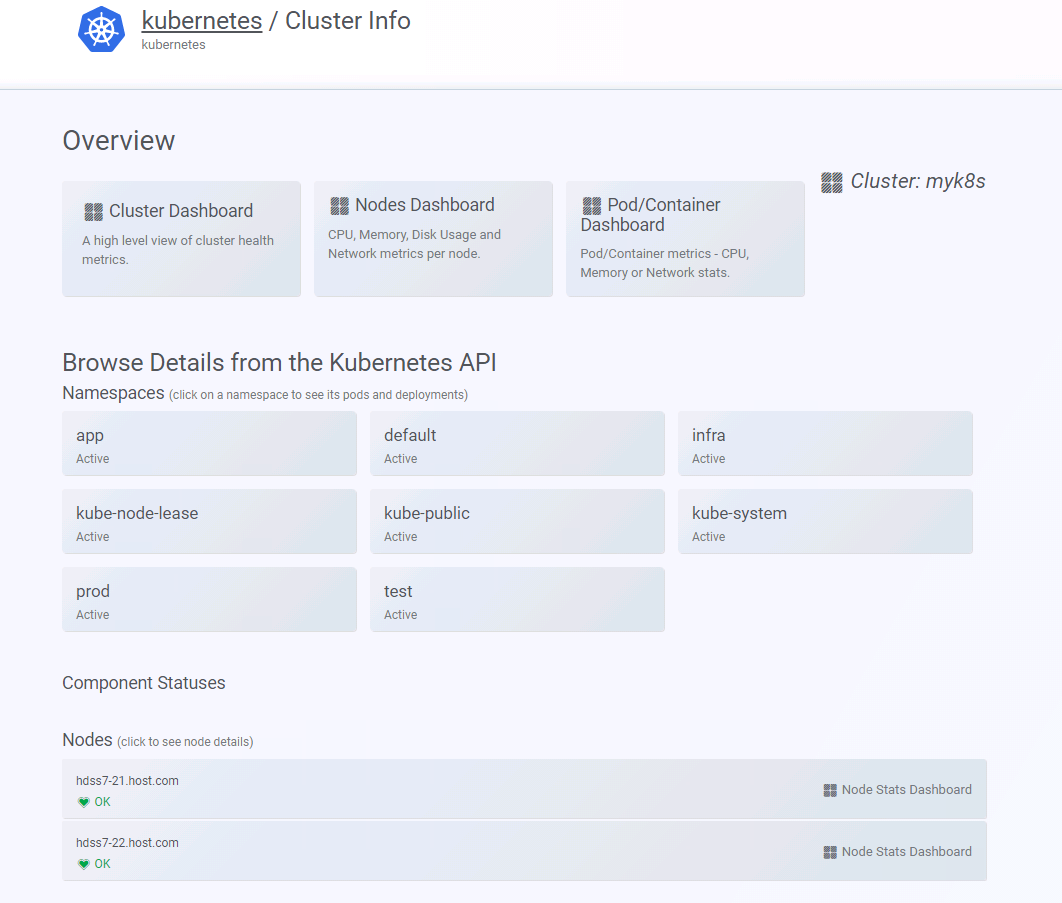
找到我们刚才安装的插件里面的kubernetes,启用,然后新建cluster
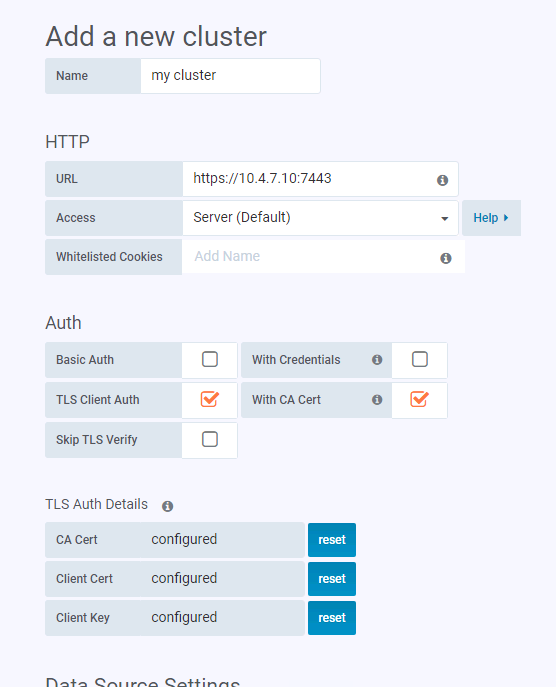
添加完需要稍等几分钟,在没有取到数据之前,会报http forbidden,没关系,等一会就好。大概2-5分钟。
配置alert告警插件:
# docker pull docker.io/prom/alertmanager:v0.14.0

# docker tag 30594e96cbe8 harbor.od.com/infra/alertmanager:v0.14.0

# docker push harbor.od.com/infra/alertmanager:v0.14.0
资源配置清单:
1、cm.yaml
apiVersion: v1

kind: ConfigMap

metadata:

  name: alertmanager-config

  namespace: infra

data:

  config.yml: |-

    global:

      # 在没有报警的情况下声明为已解决的时间

      resolve_timeout: 5m

      # 配置邮件发送信息

      smtp_smarthost: 'smtp.163.com:25'

      smtp_from: 'xxx@163.com'

      smtp_auth_username: 'xxx@163.com'

      smtp_auth_password: 'xxxxxx'

      smtp_require_tls: false

    # 所有报警信息进入后的根路由,用来设置报警的分发策略

    route:

      # 这里的标签列表是接收到报警信息后的重新分组标签,例如,接收到的报警信息里面有许多具有 cluster=A 和 alertname=LatncyHigh 这样的标签的报警信息将会批量被聚合到一个分组里面

      group_by: ['alertname', 'cluster']

      # 当一个新的报警分组被创建后,需要等待至少group_wait时间来初始化通知,这种方式可以确保您能有足够的时间为同一分组来获取多个警报,然后一起触发这个报警信息。

      group_wait: 30s

      # 当第一个报警发送后,等待'group_interval'时间来发送新的一组报警信息。

      group_interval: 5m

      # 如果一个报警信息已经发送成功了,等待'repeat_interval'时间来重新发送他们

      repeat_interval: 5m

      # 默认的receiver:如果一个报警没有被一个route匹配,则发送给默认的接收器

      receiver: default

    receivers:

    - name: 'default'

      email_configs:

      - to: 'xxxx@qq.com'

        send_resolved: true
2、dp.yaml
apiVersion: extensions/v1beta1

kind: Deployment

metadata:

  name: alertmanager

  namespace: infra

spec:

  replicas: 1

  selector:

    matchLabels:

      app: alertmanager

  template:

    metadata:

      labels:

        app: alertmanager

    spec:

      containers:

      - name: alertmanager

        image: harbor.od.com/infra/alertmanager:v0.14.0

        args:

          - "--config.file=/etc/alertmanager/config.yml"

          - "--storage.path=/alertmanager"

        ports:

        - name: alertmanager

          containerPort: 9093

        volumeMounts:

        - name: alertmanager-cm

          mountPath: /etc/alertmanager

      volumes:

      - name: alertmanager-cm

        configMap:

          name: alertmanager-config

      imagePullSecrets:

      - name: harbor
3、svc.yaml
apiVersion: v1

kind: Service

metadata:

  name: alertmanager

  namespace: infra

spec:

  selector:

    app: alertmanager

  ports:

    - port: 80

      targetPort: 9093
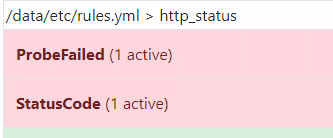
基础报警规则:
# vi /data/nfs-volume/prometheus/etc/rules.yml
groups:

- name: hostStatsAlert

  rules:

  - alert: hostCpuUsageAlert

    expr: sum(avg without (cpu)(irate(node_cpu{mode!='idle'}[5m]))) by (instance) > 0.85

    for: 5m

    labels:

      severity: warning

    annotations:

      summary: "{{ $labels.instance }} CPU usage above 85% (current value: {{ $value }}%)"

  - alert: hostMemUsageAlert

    expr: (node_memory_MemTotal - node_memory_MemAvailable)/node_memory_MemTotal > 0.85

    for: 5m

    labels:

      severity: warning

    annotations:

      summary: "{{ $labels.instance }} MEM usage above 85% (current value: {{ $value }}%)"

  - alert: OutOfInodes

    expr: node_filesystem_free{fstype="overlay",mountpoint ="/"} / node_filesystem_size{fstype="overlay",mountpoint ="/"} * 100 < 10

    for: 5m

    labels:

      severity: warning

    annotations:

      summary: "Out of inodes (instance {{ $labels.instance }})"

      description: "Disk is almost running out of available inodes (< 10% left) (current value: {{ $value }})"

  - alert: OutOfDiskSpace

    expr: node_filesystem_free{fstype="overlay",mountpoint ="/rootfs"} / node_filesystem_size{fstype="overlay",mountpoint ="/rootfs"} * 100 < 10

    for: 5m

    labels:

      severity: warning

    annotations:

      summary: "Out of disk space (instance {{ $labels.instance }})"

      description: "Disk is almost full (< 10% left) (current value: {{ $value }})"

  - alert: UnusualNetworkThroughputIn

    expr: sum by (instance) (irate(node_network_receive_bytes[2m])) / 1024 / 1024 > 100

    for: 5m

    labels:

      severity: warning

    annotations:

      summary: "Unusual network throughput in (instance {{ $labels.instance }})"

      description: "Host network interfaces are probably receiving too much data (> 100 MB/s) (current value: {{ $value }})"

  - alert: UnusualNetworkThroughputOut

    expr: sum by (instance) (irate(node_network_transmit_bytes[2m])) / 1024 / 1024 > 100

    for: 5m

    labels:

      severity: warning

    annotations:

      summary: "Unusual network throughput out (instance {{ $labels.instance }})"

      description: "Host network interfaces are probably sending too much data (> 100 MB/s) (current value: {{ $value }})"

  - alert: UnusualDiskReadRate

    expr: sum by (instance) (irate(node_disk_bytes_read[2m])) / 1024 / 1024 > 50

    for: 5m

    labels:

      severity: warning

    annotations:

      summary: "Unusual disk read rate (instance {{ $labels.instance }})"

      description: "Disk is probably reading too much data (> 50 MB/s) (current value: {{ $value }})"

  - alert: UnusualDiskWriteRate

    expr: sum by (instance) (irate(node_disk_bytes_written[2m])) / 1024 / 1024 > 50

    for: 5m

    labels:

      severity: warning

    annotations:

      summary: "Unusual disk write rate (instance {{ $labels.instance }})"

      description: "Disk is probably writing too much data (> 50 MB/s) (current value: {{ $value }})"

  - alert: UnusualDiskReadLatency

    expr: rate(node_disk_read_time_ms[1m]) / rate(node_disk_reads_completed[1m]) > 100

    for: 5m

    labels:

      severity: warning

    annotations:

      summary: "Unusual disk read latency (instance {{ $labels.instance }})"

      description: "Disk latency is growing (read operations > 100ms) (current value: {{ $value }})"

  - alert: UnusualDiskWriteLatency

    expr: rate(node_disk_write_time_ms[1m]) / rate(node_disk_writes_completedl[1m]) > 100

    for: 5m

    labels:

      severity: warning

    annotations:

      summary: "Unusual disk write latency (instance {{ $labels.instance }})"

      description: "Disk latency is growing (write operations > 100ms) (current value: {{ $value }})"

- name: http_status

  rules:

  - alert: ProbeFailed

    expr: probe_success == 0

    for: 1m

    labels:

      severity: error

    annotations:

      summary: "Probe failed (instance {{ $labels.instance }})"

      description: "Probe failed (current value: {{ $value }})"

  - alert: StatusCode

    expr: probe_http_status_code <= 199 OR probe_http_status_code >= 400

    for: 1m

    labels:

      severity: error

    annotations:

      summary: "Status Code (instance {{ $labels.instance }})"

      description: "HTTP status code is not 200-399 (current value: {{ $value }})"

  - alert: SslCertificateWillExpireSoon

    expr: probe_ssl_earliest_cert_expiry - time() < 86400 * 30

    for: 5m

    labels:

      severity: warning

    annotations:

      summary: "SSL certificate will expire soon (instance {{ $labels.instance }})"

      description: "SSL certificate expires in 30 days (current value: {{ $value }})"

  - alert: SslCertificateHasExpired

    expr: probe_ssl_earliest_cert_expiry - time()  <= 0

    for: 5m

    labels:

      severity: error

    annotations:

      summary: "SSL certificate has expired (instance {{ $labels.instance }})"

      description: "SSL certificate has expired already (current value: {{ $value }})"

  - alert: BlackboxSlowPing

    expr: probe_icmp_duration_seconds > 2

    for: 5m

    labels:

      severity: warning

    annotations:

      summary: "Blackbox slow ping (instance {{ $labels.instance }})"

      description: "Blackbox ping took more than 2s (current value: {{ $value }})"

  - alert: BlackboxSlowRequests

    expr: probe_http_duration_seconds > 2

    for: 5m

    labels:

      severity: warning

    annotations:

      summary: "Blackbox slow requests (instance {{ $labels.instance }})"

      description: "Blackbox request took more than 2s (current value: {{ $value }})"

  - alert: PodCpuUsagePercent

    expr: sum(sum(label_replace(irate(container_cpu_usage_seconds_total[1m]),"pod","$1","container_label_io_kubernetes_pod_name", "(.*)"))by(pod) / on(pod) group_right kube_pod_container_resource_limits_cpu_cores *100 )by(container,namespace,node,pod,severity) > 80

    for: 5m

    labels:

      severity: warning

    annotations:

      summary: "Pod cpu usage percent has exceeded 80% (current value: {{ $value }}%)"
在prometheus.yml中添加配置:
# vi prometheus.yml
alerting:

  alertmanagers:

    - static_configs:

        - targets: ["alertmanager"]

rule_files:

 - "/data/etc/rules.yml"
重载配置:
# curl -X POST http://prometheus.od.com/-/reload
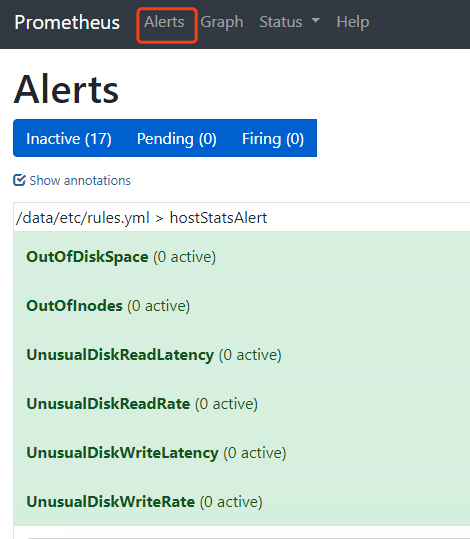
以上这些就是我们的告警规则
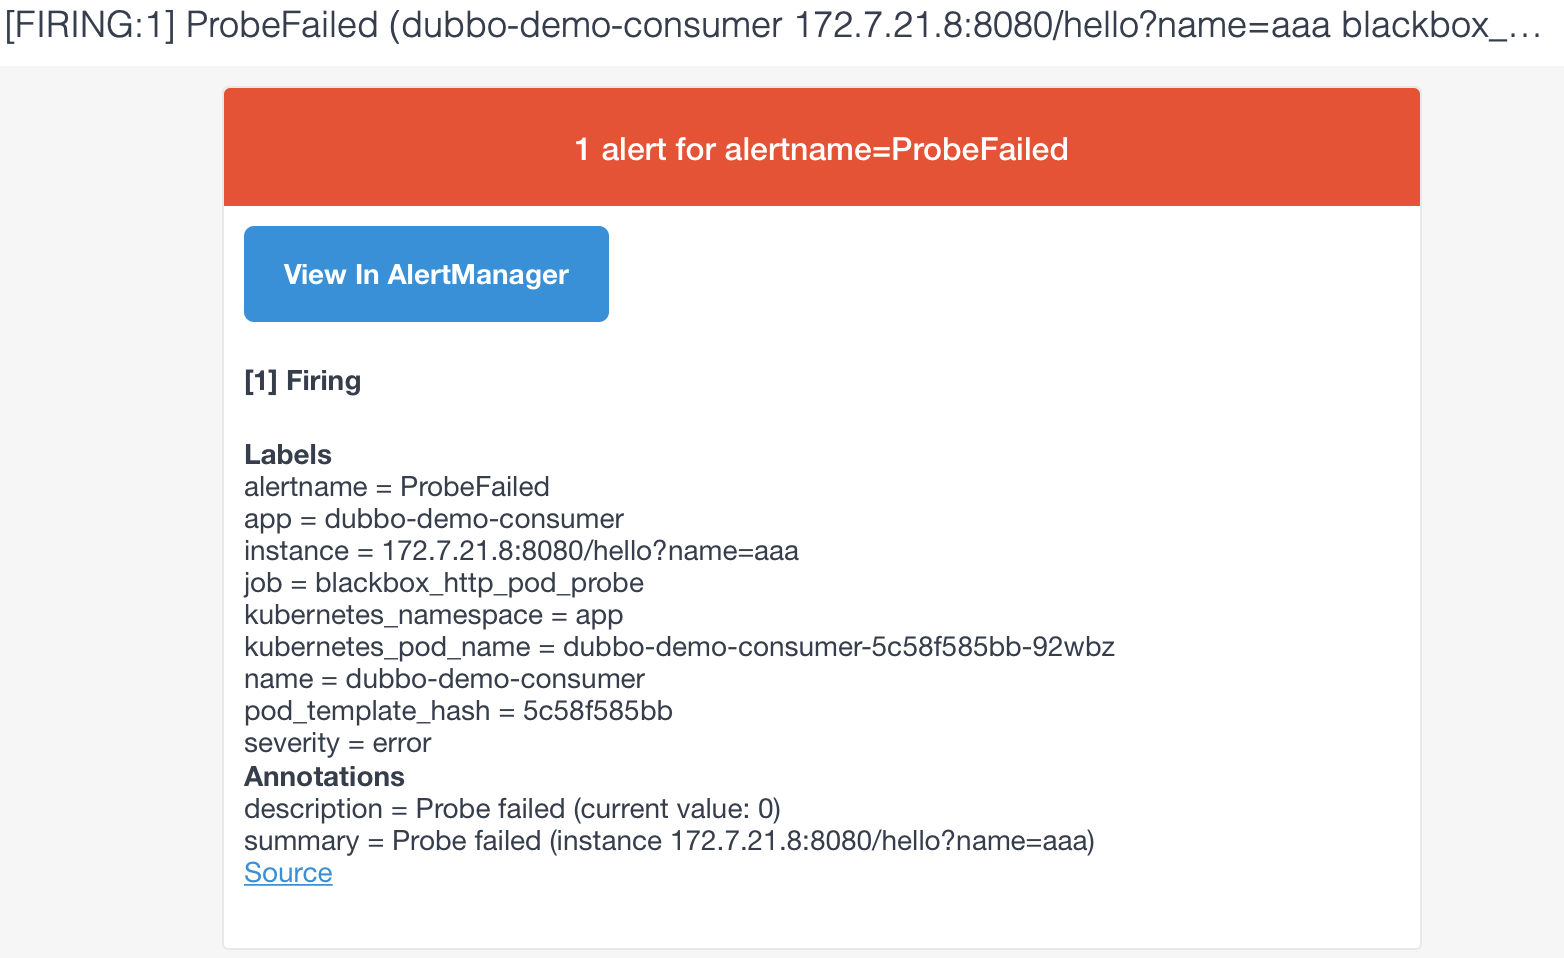
测试告警:
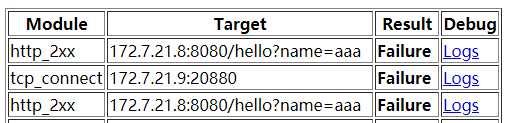
把app命名空间里的dubbo-demo-service给停掉:

看下blackbox里的信息:
看下alert:
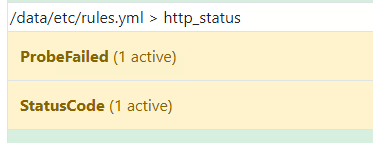
红色的时候就开会发邮件告警:
已经收到告警了,后续上生产,还会更新如何添加微信、钉钉、短信告警
如果需要自己定制告警规则和告警内容,需要研究一下promql,自己修改配置文件。
kubernetes生态--交付prometheus监控及grafana炫酷dashboard到k8s集群的更多相关文章
- 基于prometheus监控k8s集群
本文建立在你已经会安装prometheus服务的基础之上,如果你还不会安装,请参考:prometheus多维度监控容器 如果你还没有安装库k8s集群,情参考: 从零开始搭建基于calico的kuben ...
- Kubernetes之利用prometheus监控K8S集群
prometheus它是一个主动拉取的数据库,在K8S中应该展示图形的grafana数据实例化要保存下来,使用分布式文件系统加动态PV,但是在本测试环境中使用本地磁盘,安装采集数据的agent使用Da ...
- 容器编排系统K8s之Prometheus监控系统+Grafana部署
前文我们聊到了k8s的apiservice资源结合自定义apiserver扩展原生apiserver功能的相关话题,回顾请参考:https://www.cnblogs.com/qiuhom-1874/ ...
- Kubernetes学习之路(二十三)之资源指标和集群监控
目录 1.资源指标和资源监控 2.Weave Scope监控集群 (1)Weave Scope部署 (2)使用 Scope (3)拓扑结构 (4)实时资源监控 (5)在线操作 (6)强大的搜索功能 2 ...
- Prometheus 监控K8S集群资源监控
Prometheus 监控K8S集群中Pod 目前cAdvisor集成到了kubelet组件内,可以在kubernetes集群中每个启动了kubelet的节点使用cAdvisor提供的metrics接 ...
- 基于k8s集群部署prometheus监控ingress nginx
目录 基于k8s集群部署prometheus监控ingress nginx 1.背景和环境概述 2.修改prometheus配置 3.检查是否生效 4.配置grafana图形 基于k8s集群部署pro ...
- 基于k8s集群部署prometheus监控etcd
目录 基于k8s集群部署prometheus监控etcd 1.背景和环境概述 2.修改prometheus配置 3.检查是否生效 4.配置grafana图形 基于k8s集群部署prometheus监控 ...
- kubernetes实战-交付dubbo服务到k8s集群(六)使用blue ocean流水线构建dubbo-consumer服务
我们这里的dubbo-consumer是dubbo-demo-service的消费者: 我们之前已经在jenkins配置好了流水线,只需要填写参数就行了. 由于dubbo-consumer用的gite ...
- 如何使用helm优雅安装prometheus-operator,并监控k8s集群微服务
前言:随着云原生概念盛行,对于容器.服务.节点以及集群的监控变得越来越重要.Prometheus 作为 Kubernetes 监控的事实标准,有着强大的功能和良好的生态.但是它不支持分布式,不支持数据 ...
随机推荐
- CTFhub刷题记录
一 [WesternCTF2018]shrine 没什么好说的,SSTI模版注入类问题,过滤了()但是我们不慌.开始注入,{{29*3}}测试通过. 发现是jinjia2的模版注入.关键点在于没有() ...
- 入门OJ:亲戚
题目描述 或许你并不知道,你的某个朋友是你的亲戚.他可能是你的曾祖父的外公的女婿的外甥女的表姐的孙子.如果能得到完整的家谱,判断两个人是否亲戚应该是可行的,但如果两个人的最近公共祖先与他们相隔好几代, ...
- (09)-Python3之--类的三大特性(封装、继承、多态)
1.封装 封装,就是只能在类的内部访问,外部访问属性或方法会报异常,python中的封装很简单,只要在属性前或者方法名前加上两个下划线就可以,如self.__name,def __eat(self)这 ...
- jackson学习之四:WRAP_ROOT_VALUE(root对象)
欢迎访问我的GitHub https://github.com/zq2599/blog_demos 内容:所有原创文章分类汇总及配套源码,涉及Java.Docker.Kubernetes.DevOPS ...
- Hmailserver搭建邮箱服务器
由于阿里云,谷歌云,腾讯云等服务器都不开放25端口和pop3端口,想要使用邮箱服务得购买他们的企业邮箱,但是对于个人而言比较贵. 所以我们需要利用家庭宽带申请公网IP. 首先打电话给运营商客服,申请动 ...
- RPC 接口必须是业务职责
https://mp.weixin.qq.com/s/MYSF8lCF92ItG_Lc8nOspg 一个加班多新人多团队,我们的代码问题与重构 陈于喆 高可用架构 2020-10-21 微服务编码 ...
- ModuleNotFoundError 模块寻找路径
t = os.path.dirname(os.path.dirname((os.path.dirname(os.path.abspath(__file__)))))os.path.sys.path.a ...
- muduo 网络库的整体架构图和一个简化版本的架构设计
https://blog.csdn.net/adkada1/article/details/54342275 简析 https://blog.csdn.net/amoscykl/article/det ...
- py, pyc, pyw, pyo, pyd Compiled Python File (.pyc) 和Java或.NET相比,Python的Virtual Machine距离真实机器的距离更远
https://my.oschina.net/renwofei423/blog/17404 1. PyCodeObject与Pyc文件 通常认为,Python是一种解释性的语言,但是这种说法 ...
- HDU1814和平委员会
题目大意: 有n对的人,编号从1-2*n,m对的人之间互相不喜欢,每对人中必徐选1个人加入和平委员会,求字典序最小的解 -------------------------------- 2-SAT问题 ...