Prometheus神器之监控K8s集群
Prometheus 简介
Prometheus是SoundCloud开源的一款开源软件。它的实现参考了Google内部的监控实现,与源自Google的Kubernetes结合起来非常合适。另外相比influxdb的方案,性能更加突出,而且还内置了报警功能。它针对大规模的集群环境设计了拉取式的数据采集方式,你只需要在你的应用里面实现一个metrics接口,然后把这个接口告诉Prometheus就可以完成数据采集了。
安装Prometheus
首先我们使用ConfigMap的形式来设置Prometheus的配置文件,如下
apiVersion: v1

kind: ConfigMap

metadata:

  name: prometheus-configuration

  labels:

    app.kubernetes.io/name: prometheus

    app.kubernetes.io/part-of: ingress-nginx

    name: prometheus-configuration

  namespace: ingress-nginx

data:

  prometheus.yml: |-

    global:

      scrape_interval: 10s

    scrape_configs:

    - job_name: 'ingress-nginx-endpoints'

      kubernetes_sd_configs:

      - role: pod

        namespaces:

          names:

          - ingress-nginx

      relabel_configs:

      - source_labels: [__meta_kubernetes_pod_annotation_prometheus_io_scrape]

        action: keep

        regex: true

      - source_labels: [__meta_kubernetes_pod_annotation_prometheus_io_scheme]

        action: replace

        target_label: __scheme__

        regex: (https?)

      - source_labels: [__meta_kubernetes_pod_annotation_prometheus_io_path]

        action: replace

        target_label: __metrics_path__

        regex: (.+)

      - source_labels: [__address__, __meta_kubernetes_pod_annotation_prometheus_io_port]

        action: replace

        target_label: __address__

        regex: ([^:]+)(?::\d+)?;(\d+)

        replacement: $1:$2

      - source_labels: [__meta_kubernetes_service_name]

        regex: prometheus-server

        action: drop

---
将以上配置文件保存为configuration.yaml,然后执行命令:
$ kubectl apply -f configuration.yaml

namespace "ingress-nginx" created

configmap "prometheus-configuration" created
通过Deployment部署Prometheus,yaml文件如下:
---

apiVersion: rbac.authorization.k8s.io/v1beta1

kind: ClusterRole

metadata:

  name: prometheus

rules:

  - apiGroups: [""] # "" indicates the core API group

    resources:

      - nodes

      - nodes/proxy

      - services

      - endpoints

      - pods

    verbs:

      - get

      - watch

      - list

  - apiGroups:

      - extensions

    resources:

      - ingresses

    verbs:

      - get

      - watch

      - list

  - nonResourceURLs: ["/metrics"]

    verbs:

      - get

---

apiVersion: v1

kind: ServiceAccount

metadata:

  name: prometheus

  namespace: ingress-nginx

  labels:

    app: prometheus

---

apiVersion: rbac.authorization.k8s.io/v1beta1

kind: ClusterRoleBinding

metadata:

  name: prometheus

subjects:

  - kind: ServiceAccount

    name: prometheus

    namespace: ingress-nginx

roleRef:

  kind: ClusterRole

  name: prometheus

  apiGroup: rbac.authorization.k8s.io

---

apiVersion: v1

kind: ConfigMap

metadata:

  name: prometheus-conf

  namespace: ingress-nginx

  labels:

    app: prometheus

data:

  prometheus.yml: |-

    # my global config

    global:

      scrape_interval:     15s # Set the scrape interval to every 15 seconds. Default is every 1 minute.

      evaluation_interval: 15s # Evaluate rules every 15 seconds. The default is every 1 minute.

      # scrape_timeout is set to the global default (10s).

    # Alertmanager configuration

    alerting:

      alertmanagers:

      - static_configs:

        - targets:

          # - alertmanager:9093

    # Load rules once and periodically evaluate them according to the global 'evaluation_interval'.

    rule_files:

      # - "first_rules.yml"

      # - "second_rules.yml"

    # A scrape configuration containing exactly one endpoint to scrape:

    # Here it's Prometheus itself.

    scrape_configs:

      # The job name is added as a label `job=<job_name>` to any timeseries scraped from this config.

      - job_name: 'prometheus'

        # metrics_path defaults to '/metrics'

        # scheme defaults to 'http'.

        static_configs:

          - targets: ['localhost:9090']

      - job_name: 'grafana'

        static_configs:

          - targets:

              - 'grafana.ingress-nginx:3000'

      - job_name: 'kubernetes-apiservers'

        kubernetes_sd_configs:

        - role: endpoints

        # Default to scraping over https. If required, just disable this or change to

        # `http`.

        scheme: https

        # This TLS & bearer token file config is used to connect to the actual scrape

        # endpoints for cluster components. This is separate to discovery auth

        # configuration because discovery & scraping are two separate concerns in

        # Prometheus. The discovery auth config is automatic if Prometheus runs inside

        # the cluster. Otherwise, more config options have to be provided within the

        # <kubernetes_sd_config>.

        tls_config:

          ca_file: /var/run/secrets/kubernetes.io/serviceaccount/ca.crt

          # If your node certificates are self-signed or use a different CA to the

          # master CA, then disable certificate verification below. Note that

          # certificate verification is an integral part of a secure infrastructure

          # so this should only be disabled in a controlled environment. You can

          # disable certificate verification by uncommenting the line below.

          #

          # insecure_skip_verify: true

        bearer_token_file: /var/run/secrets/kubernetes.io/serviceaccount/token

        # Keep only the default/kubernetes service endpoints for the https port. This

        # will add targets for each API server which Kubernetes adds an endpoint to

        # the default/kubernetes service.

        relabel_configs:

        - source_labels: [__meta_kubernetes_namespace, __meta_kubernetes_service_name, __meta_kubernetes_endpoint_port_name]

          action: keep

          regex: default;kubernetes;https

      # Scrape config for nodes (kubelet).

      #

      # Rather than connecting directly to the node, the scrape is proxied though the

      # Kubernetes apiserver.  This means it will work if Prometheus is running out of

      # cluster, or can't connect to nodes for some other reason (e.g. because of

      # firewalling).

      - job_name: 'kubernetes-nodes'

        # Default to scraping over https. If required, just disable this or change to

        # `http`.

        scheme: https

        # This TLS & bearer token file config is used to connect to the actual scrape

        # endpoints for cluster components. This is separate to discovery auth

        # configuration because discovery & scraping are two separate concerns in

        # Prometheus. The discovery auth config is automatic if Prometheus runs inside

        # the cluster. Otherwise, more config options have to be provided within the

        # <kubernetes_sd_config>.

        tls_config:

          ca_file: /var/run/secrets/kubernetes.io/serviceaccount/ca.crt

        bearer_token_file: /var/run/secrets/kubernetes.io/serviceaccount/token

        kubernetes_sd_configs:

        - role: node

        relabel_configs:

        - action: labelmap

          regex: __meta_kubernetes_node_label_(.+)

        - target_label: __address__

          replacement: kubernetes.default.svc:443

        - source_labels: [__meta_kubernetes_node_name]

          regex: (.+)

          target_label: __metrics_path__

          replacement: /api/v1/nodes/${1}/proxy/metrics

      # Scrape config for Kubelet cAdvisor.

      #

      # This is required for Kubernetes 1.7.3 and later, where cAdvisor metrics

      # (those whose names begin with 'container_') have been removed from the

      # Kubelet metrics endpoint.  This job scrapes the cAdvisor endpoint to

      # retrieve those metrics.

      #

      # In Kubernetes 1.7.0-1.7.2, these metrics are only exposed on the cAdvisor

      # HTTP endpoint; use "replacement: /api/v1/nodes/${1}:4194/proxy/metrics"

      # in that case (and ensure cAdvisor's HTTP server hasn't been disabled with

      # the --cadvisor-port=0 Kubelet flag).

      #

      # This job is not necessary and should be removed in Kubernetes 1.6 and

      # earlier versions, or it will cause the metrics to be scraped twice.

      - job_name: 'kubernetes-cadvisor'

        # Default to scraping over https. If required, just disable this or change to

        # `http`.

        scheme: https

        # This TLS & bearer token file config is used to connect to the actual scrape

        # endpoints for cluster components. This is separate to discovery auth

        # configuration because discovery & scraping are two separate concerns in

        # Prometheus. The discovery auth config is automatic if Prometheus runs inside

        # the cluster. Otherwise, more config options have to be provided within the

        # <kubernetes_sd_config>.

        tls_config:

          ca_file: /var/run/secrets/kubernetes.io/serviceaccount/ca.crt

        bearer_token_file: /var/run/secrets/kubernetes.io/serviceaccount/token

        kubernetes_sd_configs:

        - role: node

        relabel_configs:

        - action: labelmap

          regex: __meta_kubernetes_node_label_(.+)

        - target_label: __address__

          replacement: kubernetes.default.svc:443

        - source_labels: [__meta_kubernetes_node_name]

          regex: (.+)

          target_label: __metrics_path__

          replacement: /api/v1/nodes/${1}/proxy/metrics/cadvisor

      # Scrape config for service endpoints.

      #

      # The relabeling allows the actual service scrape endpoint to be configured

      # via the following annotations:

      #

      # * `prometheus.io/scrape`: Only scrape services that have a value of `true`

      # * `prometheus.io/scheme`: If the metrics endpoint is secured then you will need

      # to set this to `https` & most likely set the `tls_config` of the scrape config.

      # * `prometheus.io/path`: If the metrics path is not `/metrics` override this.

      # * `prometheus.io/port`: If the metrics are exposed on a different port to the

      # service then set this appropriately.

      - job_name: 'kubernetes-service-endpoints'

        kubernetes_sd_configs:

        - role: endpoints

        relabel_configs:

        - source_labels: [__meta_kubernetes_service_annotation_prometheus_io_scrape]

          action: keep

          regex: true

        - source_labels: [__meta_kubernetes_service_annotation_prometheus_io_scheme]

          action: replace

          target_label: __scheme__

          regex: (https?)

        - source_labels: [__meta_kubernetes_service_annotation_prometheus_io_path]

          action: replace

          target_label: __metrics_path__

          regex: (.+)

        - source_labels: [__address__, __meta_kubernetes_service_annotation_prometheus_io_port]

          action: replace

          target_label: __address__

          regex: ([^:]+)(?::\d+)?;(\d+)

          replacement: $1:$2

        - action: labelmap

          regex: __meta_kubernetes_service_label_(.+)

        - source_labels: [__meta_kubernetes_namespace]

          action: replace

          target_label: kubernetes_namespace

        - source_labels: [__meta_kubernetes_service_name]

          action: replace

          target_label: kubernetes_name

      # Example scrape config for probing services via the Blackbox Exporter.

      #

      # The relabeling allows the actual service scrape endpoint to be configured

      # via the following annotations:

      #

      # * `prometheus.io/probe`: Only probe services that have a value of `true`

      - job_name: 'kubernetes-services'

        metrics_path: /probe

        params:

          module: [http_2xx]

        kubernetes_sd_configs:

        - role: service

        relabel_configs:

        - source_labels: [__meta_kubernetes_service_annotation_prometheus_io_probe]

          action: keep

          regex: true

        - source_labels: [__address__]

          target_label: __param_target

        - target_label: __address__

          replacement: blackbox-exporter.example.com:9115

        - source_labels: [__param_target]

          target_label: instance

        - action: labelmap

          regex: __meta_kubernetes_service_label_(.+)

        - source_labels: [__meta_kubernetes_namespace]

          target_label: kubernetes_namespace

        - source_labels: [__meta_kubernetes_service_name]

          target_label: kubernetes_name

      # Example scrape config for probing ingresses via the Blackbox Exporter.

      #

      # The relabeling allows the actual ingress scrape endpoint to be configured

      # via the following annotations:

      #

      # * `prometheus.io/probe`: Only probe services that have a value of `true`

      - job_name: 'kubernetes-ingresses'

        metrics_path: /probe

        params:

          module: [http_2xx]

        kubernetes_sd_configs:

          - role: ingress

        relabel_configs:

          - source_labels: [__meta_kubernetes_ingress_annotation_prometheus_io_probe]

            action: keep

            regex: true

          - source_labels: [__meta_kubernetes_ingress_scheme,__address__,__meta_kubernetes_ingress_path]

            regex: (.+);(.+);(.+)

            replacement: ${1}://${2}${3}

            target_label: __param_target

          - target_label: __address__

            replacement: blackbox-exporter.example.com:9115

          - source_labels: [__param_target]

            target_label: instance

          - action: labelmap

            regex: __meta_kubernetes_ingress_label_(.+)

          - source_labels: [__meta_kubernetes_namespace]

            target_label: kubernetes_namespace

          - source_labels: [__meta_kubernetes_ingress_name]

            target_label: kubernetes_name

      # Example scrape config for pods

      #

      # The relabeling allows the actual pod scrape endpoint to be configured via the

      # following annotations:

      #

      # * `prometheus.io/scrape`: Only scrape pods that have a value of `true`

      # * `prometheus.io/path`: If the metrics path is not `/metrics` override this.

      # * `prometheus.io/port`: Scrape the pod on the indicated port instead of the

      # pod's declared ports (default is a port-free target if none are declared).

      - job_name: 'kubernetes-pods'

        kubernetes_sd_configs:

        - role: pod

        relabel_configs:

        - source_labels: [__meta_kubernetes_pod_annotation_prometheus_io_scrape]

          action: keep

          regex: true

        - source_labels: [__meta_kubernetes_pod_annotation_prometheus_io_path]

          action: replace

          target_label: __metrics_path__

          regex: (.+)

        - source_labels: [__address__, __meta_kubernetes_pod_annotation_prometheus_io_port]

          action: replace

          regex: ([^:]+)(?::\d+)?;(\d+)

          replacement: $1:$2

          target_label: __address__

        - action: labelmap

          regex: __meta_kubernetes_pod_label_(.+)

        - source_labels: [__meta_kubernetes_namespace]

          action: replace

          target_label: kubernetes_namespace

        - source_labels: [__meta_kubernetes_pod_name]

          action: replace

          target_label: kubernetes_pod_name

---

apiVersion: v1

kind: ConfigMap

metadata:

  name: prometheus-rules

  namespace: ingress-nginx

  labels:

    app: prometheus

data:

  cpu-usage.rule: |

    groups:

      - name: NodeCPUUsage

        rules:

          - alert: NodeCPUUsage

            expr: (100 - (avg by (instance) (irate(node_cpu{name="node-exporter",mode="idle"}[5m])) * 100)) > 75

            for: 2m

            labels:

              severity: "page"

            annotations:

              summary: "{{$labels.instance}}: High CPU usage detected"

              description: "{{$labels.instance}}: CPU usage is above 75% (current value is: {{ $value }})"

---

kind: Deployment

apiVersion: apps/v1beta2

metadata:

  labels:

    app: prometheus

  name: prometheus

  namespace: ingress-nginx

spec:

  replicas: 1

  revisionHistoryLimit: 10

  selector:

    matchLabels:

      app: prometheus

  template:

    metadata:

      labels:

        app: prometheus

    spec:

      serviceAccountName: prometheus

      securityContext:

        runAsUser: 65534

        fsGroup: 65534

      containers:

        - name: prometheus

          image: prom/prometheus:latest

          volumeMounts:

            - mountPath: /etc/prometheus/prometheus.yml

              name: prometheus-conf-volume

              subPath: prometheus.yml

            - mountPath: /etc/prometheus/rules

              name: prometheus-rules-volume

          ports:

            - containerPort: 9090

              protocol: TCP

      volumes:

        - name: prometheus-conf-volume

          configMap:

            name: prometheus-conf

        - name: prometheus-rules-volume

          configMap:

            name: prometheus-rules

      tolerations:

        - key: node-role.kubernetes.io/master

          effect: NoSchedule

---

kind: Service

apiVersion: v1

metadata:

  annotations:

    prometheus.io/scrape: 'true'

  labels:

    app: prometheus

  name: prometheus-service

  namespace: ingress-nginx

spec:

  ports:

    - port: 9090

      targetPort: 9090

  selector:

    app: prometheus

  type: NodePort
将以上文件保存为prometheus.yaml,然后执行命令:
$ kubectl apply -f prometheus.yaml

clusterrole "prometheus" created

serviceaccount "prometheus" created

clusterrolebinding "prometheus" created

configmap "prometheus-conf" created

configmap "prometheus-rules" created

deployment "prometheus" created

service "prometheus-service" created
部署node-exporter,为了能够收集每个节点的信息,所以我们这里使用DaemonSet的形式部署:
kind: DaemonSet

apiVersion: apps/v1beta2

metadata:

  labels:

    app: node-exporter

  name: node-exporter

  namespace: ingress-nginx

spec:

  revisionHistoryLimit: 10

  selector:

    matchLabels:

      app: node-exporter

  template:

    metadata:

      labels:

        app: node-exporter

    spec:

      containers:

        - name: node-exporter

          image: prom/node-exporter:v0.16.0

          ports:

            - containerPort: 9100

              protocol: TCP

              name: http

      hostNetwork: true

      hostPID: true

      tolerations:

        - effect: NoSchedule

          operator: Exists

---

kind: Service

apiVersion: v1

metadata:

  labels:

    app: node-exporter

  name: node-exporter-service

  namespace: ingress-nginx

spec:

  ports:

    - name: http

      port: 9100

      nodePort: 31672

      protocol: TCP

  type: NodePort

  selector:

    app: node-exporter
将以上文件保存为node-exporter.yaml,然后执行命令:
$ kubectl apply -f node-exporter.yaml

daemonset "node-exporter" created

service "node-exporter-service" created
接下来暴露服务以便可以访问Prometheus的UI界面,查看NodePort:
[root@dtdream-dtwarebase-prod-k8s-01 monitoring]# kubectl  -s10.90.2.100:8080 -ningress-nginx get svc,po -owide

NAME                        TYPE       CLUSTER-IP       EXTERNAL-IP   PORT(S)          AGE       SELECTOR

svc/node-exporter-service   NodePort   10.254.208.254   <none>        9100:31672/TCP   55s       app=node-exporter

svc/prometheus-service      NodePort   10.254.187.175   <none>        9090:25759/TCP   3m        app=prometheus

NAME                             READY     STATUS             RESTARTS   AGE       IP             NODE

po/node-exporter-b47ch           1/1       Running            0          54s       10.90.2.102    10.90.2.102

po/node-exporter-q88pp           1/1       Running            0          54s       10.90.2.100    10.90.2.100

po/prometheus-7b7fd77c44-7cf6z   1/1       Running            0          3m        172.17.21.28   10.90.2.101
然后用浏览器访问http://10.90.2.101:9090就可以访问到Prometheus的界面了。
可以切换到Status下面的targets查看我们采集的数据是否正常:
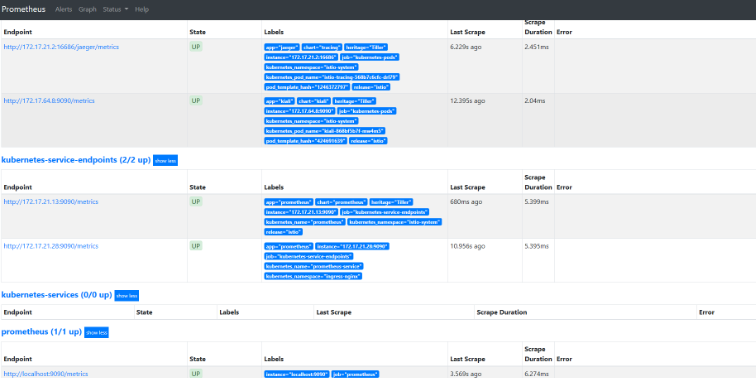
可以根据targets下面的提示信息对采集失败的数据进行修正。
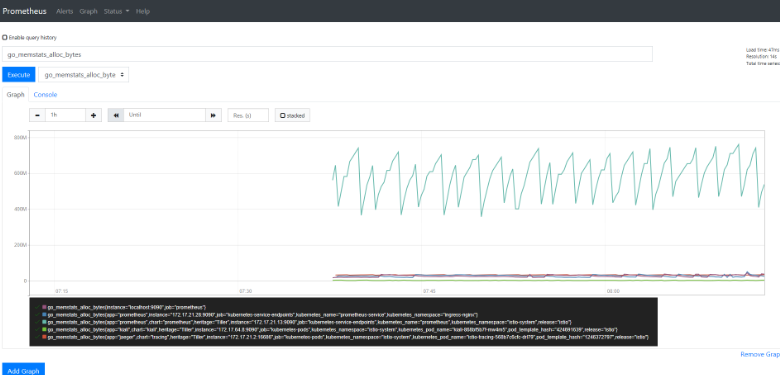
查询监控数据
Prometheus提供了API的方式进行数据查询,同样可以使用query语言进行复杂的查询任务,在上面的WEB界面上提供了基本的查询和图形化的展示功能。
比如查询每个POD的CPU使用情况,查询条件如下:
sum by (pod_name)( rate(container_cpu_usage_seconds_total{image!="", pod_name!=""}[1m] ) )
注意其中的pod_name和image要根据自己采集的数据进行区分。
安装Grafana
Prometheus以及获取到了我们采集的数据,现在我们需要一个更加强大的图标展示工具,毫无疑问选择grafana,同样的,在Kubernetes环境下面进行安装,yaml文件如下:
apiVersion: extensions/v1beta1

kind: Deployment

metadata:

  labels:

    app.kubernetes.io/name: grafana

    app.kubernetes.io/part-of: ingress-nginx

  name: grafana

  namespace: ingress-nginx

spec:

  selector:

    matchLabels:

      app.kubernetes.io/name: grafana

      app.kubernetes.io/part-of: ingress-nginx

  strategy:

    rollingUpdate:

      maxSurge: 1

      maxUnavailable: 1

    type: RollingUpdate

  template:

    metadata:

      labels:

        app.kubernetes.io/name: grafana

        app.kubernetes.io/part-of: ingress-nginx

    spec:

      containers:

        - image: grafana/grafana

          name: grafana

          ports:

            - containerPort: 3000

              protocol: TCP

          resources:

            limits:

              cpu: 500m

              memory: 2500Mi

            requests:

              cpu: 100m

              memory: 100Mi

          volumeMounts:

            - mountPath: /var/lib/grafana

              name: data

      restartPolicy: Always

      volumes:

        - emptyDir: {}

          name: data

---

apiVersion: v1

kind: Service

metadata:

  name: grafana

  namespace: ingress-nginx

  labels:

    app.kubernetes.io/name: grafana

    app.kubernetes.io/part-of: ingress-nginx

spec:

  ports:

    - port: 3000

      protocol: TCP

      targetPort: 3000

  selector:

    app.kubernetes.io/name: grafana

    app.kubernetes.io/part-of: ingress-nginx

  type: NodePort

---
将以上文件保存为grafana.yaml,然后执行命令:
$ kubectl apply -f grafana.yaml

deployment "grafana" created

service "grafana" created
可以选择使用ingress将服务暴露在外网进行访问。 访问grafanaWEB界面,我这里就直接使用的Nodeport。
查看grafana访问端口
$ kubectl  -ningress-nginx get svc,po|grep grafana

svc/grafana                 NodePort   10.254.86.182    <none>        3000:7006/TCP    2m

po/grafana-85fbffb76f-x6hqw      1/1       Running            0          2m
访问http://10.90.2.101:7006

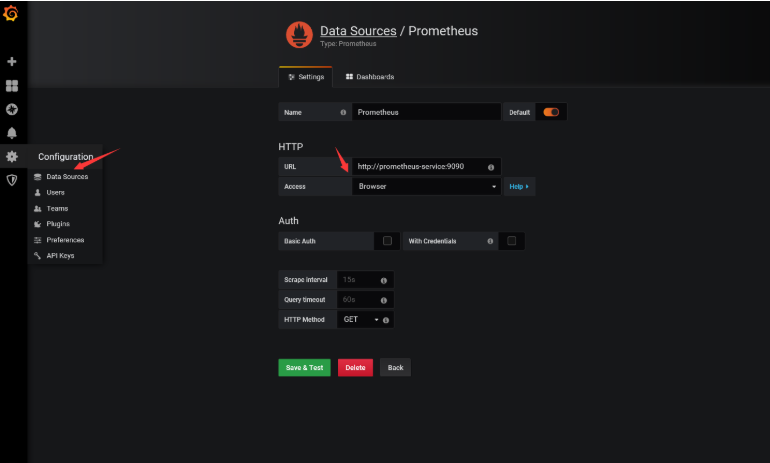
将我们上面的Prometheus添加到grafana数据源中去。
然后添加我们的Dashboard,可以使用https://grafana.com/dashboards/162,可以下载该页面的dashboard的json文件,然后直接导入到grafana中去,但是需要注意其中的一些参数,需要根据prometheus中采集到实际数据进行填写,比如我们这里采集到容器名是name,而不是io_kubernetes_container_name,最终展示界面如下:
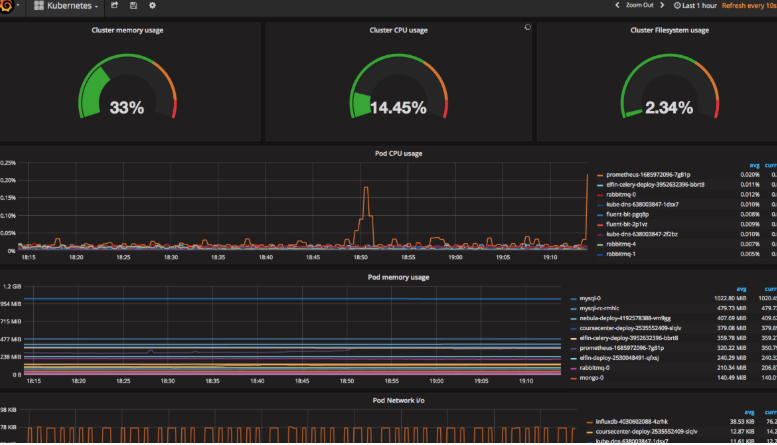
上面用的yaml文件可以到github上查看https://github.com/jcops/k8s-yaml/tree/master/monitoring
欢迎您关注程序员同行者订阅号,程序员同行者是一个技术分享平台,主要是运维自动化开发:linux、python、django、saltstack、redis、golang、docker、kubernetes、vue等经验分享及经验交流。
趁现在,关注我们
牛人并不可怕,可怕的是牛人比我们还努力!
如果您觉得不错,请别忘了转发、分享、点赞让更多的人去学习, 您的举手之劳,就是对小编最好的支持,非常感谢!

Prometheus神器之监控K8s集群的更多相关文章
- 基于prometheus监控k8s集群
本文建立在你已经会安装prometheus服务的基础之上,如果你还不会安装,请参考:prometheus多维度监控容器 如果你还没有安装库k8s集群,情参考: 从零开始搭建基于calico的kuben ...
- Kubernetes之利用prometheus监控K8S集群
prometheus它是一个主动拉取的数据库,在K8S中应该展示图形的grafana数据实例化要保存下来,使用分布式文件系统加动态PV,但是在本测试环境中使用本地磁盘,安装采集数据的agent使用Da ...
- Prometheus 监控K8S集群资源监控
Prometheus 监控K8S集群中Pod 目前cAdvisor集成到了kubelet组件内,可以在kubernetes集群中每个启动了kubelet的节点使用cAdvisor提供的metrics接 ...
- 如何使用helm优雅安装prometheus-operator,并监控k8s集群微服务
前言:随着云原生概念盛行,对于容器.服务.节点以及集群的监控变得越来越重要.Prometheus 作为 Kubernetes 监控的事实标准,有着强大的功能和良好的生态.但是它不支持分布式,不支持数据 ...
- shell脚本监控k8s集群job状态,若出现error通过触发阿里云的进程监控报警
#!/bin/bash while [ 1 ] do job_error_no=`kubectl get pod -n weifeng |grep -i "job"|grep -c ...
- 如何用prometheus监控k8s集群中业务pod的metrics
一般,我们从网上看到的帖子和资料, 都是用prometheus监控k8s的各项资源, 如api server, namespace, pod, node等. 那如果是自己的业务pod上的自定义metr ...
- 使用Prometheus和Grafana监控nacos集群
官方文档:https://nacos.io/zh-cn/docs/monitor-guide.html 按照部署文档搭建好Nacos集群 配置application.properties文件,暴露me ...
- 使用Prometheus和Grafana监控RabbitMQ集群 (使用RabbitMQ自带插件)
配置RabbitMQ集群 官方文档:https://www.rabbitmq.com/prometheus.html#quick-start 官方github地址:https://github.com ...
- 使用Prometheus和Grafana监控emqx集群
以 Prometheus为例: emqx_prometheus 支持将数据推送至 Pushgateway 中,然后再由 Promethues Server 拉取进行存储. 注意:emqx_promet ...
随机推荐
- 程序员,你还不会合理选择Filter、Interceptor、Aspect?
小伙伴们应该听说过过滤器.拦截器.切面,印象上都能够起到截断拦截的作用,在做一些业务需求时,不知道如何选择,今天老顾就来介绍一下他们之间的区别. 过滤器可以拦截到方法的请求和响应 (ServletRe ...
- IT兄弟连 Java语法教程 数组 多维数组 二维数组的声明
Java语言里提供了支持多维数组的语法.但是这里还想说,从数组底层的运行机制上来看是没有多维数组的. Java语言里的数组类型是引用类型,因此数组变量其实是一个引用,这个引用指向真实的数组内存,数组元 ...
- IT兄弟连 Java语法教程 流程控制语句 分支结构语句5
5 switch-case条件语句 Java中的第二种分支控制语句时switch语句,switch语句提供了多路支持,因此可以使程序在多个选项中进行选择.尽管一系列嵌套if语句可以执行多路测试,然而 ...
- 百度API车牌识别——Restful方式
源码下载地址:https://download.csdn.net/download/redhat588/11798294 Delphi xe 10.3.2 for windows 7 环境编译通过! ...
- 【LOJ#6682】梦中的数论(min_25筛)
[LOJ#6682]梦中的数论(min_25筛) 题面 LOJ 题解 注意题意是\(j|i\)并且\((j+k)|i\), 不难发现\(j\)和\((j+k)\)可以任意取\(i\)的任意因数,且\( ...
- OpenGL入门1.7:摄像机
每一个小步骤的源码都放在了Github 的内容为插入注释,可以先跳过 前言 我们已经知道了何为观察矩阵以及如何使用观察矩阵移动场景(我们向后移动了一点) OpenGL本身没有摄像机(Camera)的概 ...
- 练手WPF(三)——扫雷小游戏的简易实现(下)
十四.响应鼠标点击事件 (1)设置对应坐标位置为相应的前景状态 /// <summary> /// 设置单元格图样 /// </summary> /// <para ...
- SpringMVC详解------参数绑定
SpringMVC详解------参数绑定 转载于:https://blog.csdn.net/swebin/article/details/92795422 目录 1.SpringMVC 参数绑定 ...
- jquery中的ajax请求到php(学生笔记)
首先ajax的基本语法基础.(必须得引入一个jquery文件,下面的例子展示用了网上的jquery文件,要联网.) 2.请求成功(复制代码运行观察效果) <!DOCTYPE html> & ...
- [转]Redis之(一)初识Redis
原文地址:http://blog.csdn.net/u012152619/article/details/52550315 Redis之(一)初识Redis 标签: Redisredis-server ...