Prometheus监控学习笔记之Prometheus的架构及持久化
0x00 Prometheus是什么
Prometheus是一个开源的系统监控和报警工具,特点是
多维数据模型(时序列数据由metric名和一组key/value组成)
在多维度上灵活的查询语言(PromQl)
不依赖分布式存储,单主节点工作.
通过基于HTTP的pull方式采集时序数据
可以通过push gateway进行时序列数据推送(pushing)
可以通过服务发现或者静态配置去获取要采集的目标服务器
多种可视化图表及仪表盘支持
pull方式
Prometheus采集数据是用的pull也就是拉模型,通过HTTP协议去采集指标,只要应用系统能够提供HTTP接口就可以接入监控系统,相比于私有协议或二进制协议来说开发、简单。
push方式
对于定时任务这种短周期的指标采集,如果采用pull模式,可能造成任务结束了,Prometheus还没有来得及采集,这个时候可以使用加一个中转层,客户端推数据到Push Gateway缓存一下,由Prometheus从push gateway pull指标过来。(需要额外搭建Push Gateway,同时需要新增job去从gateway采数据)
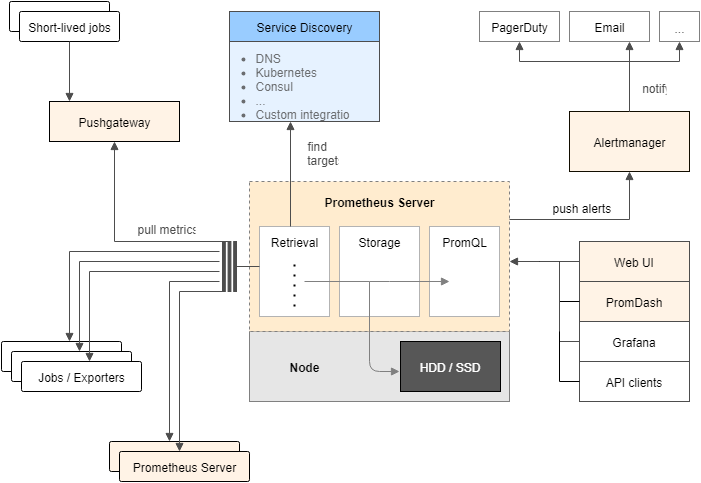
0x01 组成及架构
Prometheus server
主要负责数据采集和存储,提供PromQL查询语言的支持客户端sdk
官方提供的客户端类库有go、java、scala、python、ruby,其他还有很多第三方开发的类库,支持nodejs、php、erlang等Push Gateway
支持临时性Job主动推送指标的中间网关PromDash
使用rails开发的dashboard,用于可视化指标数据exporters
支持其他数据源的指标导入到Prometheus,支持数据库、硬件、消息中间件、存储系统、http服务器、jmx等alertmanager
实验性组件、用来进行报警prometheus_cli
命令行工具其他辅助性工具
0x02 默认配置
docker exec -it a9bd827a1d18 less /etc/prometheus/prometheus.yml
得到
# my global config

global:

  scrape_interval:     15s # Set the scrape interval to every 15 seconds. Default is every 1 minute.

  evaluation_interval: 15s # Evaluate rules every 15 seconds. The default is every 1 minute.

  # scrape_timeout is set to the global default (10s).

  # Attach these labels to any time series or alerts when communicating with

  # external systems (federation, remote storage, Alertmanager).

  external_labels:

      monitor: 'codelab-monitor'

# Load rules once and periodically evaluate them according to the global 'evaluation_interval'.

rule_files:

  # - "first.rules"

  # - "second.rules"

# A scrape configuration containing exactly one endpoint to scrape:

# Here it's Prometheus itself.

scrape_configs:

  # The job name is added as a label `job=<job_name>` to any timeseries scraped from this config.

  - job_name: 'prometheus'

    # metrics_path defaults to '/metrics'

    # scheme defaults to 'http'.

    static_configs:

      - targets: ['localhost:9090']
scrape_interval
这里是指每隔15秒钟去抓取数据(这里)evaluation_interval
指的是计算rule的间隔
0x03 Push Gateway
pushgateway有单独的镜像
docker pull prom/pushgateway
对于喜欢用push模式的应用来说,可以专门搭建一个push gateway,来适配一下。
0x04 storage
prometheus使用了G家的LevelDB来做索引(PromSQL重度依赖LevelDB),对于大量的采样数据有自己的存储层,Prometheus为每个时序数据创建一个本地文件,以1024byte大小的chunk来组织。
磁盘文件
Prometheus在storage.local.path指定的路径存储文件,默认为./data。关于chunk编码有三种
type 0
第一代的编码格式,simple delta encoding
type 1
目前默认的编码格式,double-delta encoding
type 2
variable bit-width encoding,facebook的时间序列数据库Beringei采用的编码方式
内存使用
prometheus在内存里保存了最近使用的chunks,具体chunks的最大个数可以通过storage.local.memory-chunks来设定,默认值为1048576,即1048576个chunk,大小为1G。
除了采用的数据,prometheus还需要对数据进行各种运算,因此整体内存开销肯定会比配置的local.memory-chunks大小要来的大,因此官方建议要预留3倍的local.memory-chunks的内存大小。
# As a rule of thumb, you should have at least three times more RAM available than needed by the memory chunks alone
可以通过server的metrics去查看prometheus_local_storage_memory_chunks以及process_resident_memory_byte两个指标值。
prometheus_local_storage_memory_chunks
The current number of chunks in memory, excluding cloned chunks

# 目前内存中暴露的chunks的个数
- process_resident_memory_byte
Resident memory size in bytes

# 驻存在内存的数据大小
- prometheus_local_storage_persistence_urgency_score
介于0-1之间,当该值小于等于0.7时,prometheus离开rushed模式。
当大于0.8的时候,进入rushed模式
- prometheus_local_storage_rushed_mode
1表示进入了rushed mode,0表示没有。进入了rushed模式的话,prometheus会利用storage.local.series-sync-strategy以及storage.local.checkpoint-interval的配置加速chunks的持久化。
storage参数
docker run -p 9090:9090 \

-v /tmp/prometheus-data:/prometheus-data \

prom/prometheus \

-storage.local.retention 168h0m0s \

-storage.local.max-chunks-to-persist 3024288 \

-storage.local.memory-chunks=50502740 \

-storage.local.num-fingerprint-mutexes=300960
storage.local.memory-chunks
设定prometheus内存中保留的chunks的最大个数,默认为1048576,即为1G大小
storage.local.retention
用来配置采用数据存储的时间,168h0m0s即为24*7小时,即1周
storage.local.series-file-shrink-ratio
用来控制序列文件rewrite的时机,默认是在10%的chunks被移除的时候进行rewrite,如果磁盘空间够大,不想频繁rewrite,可以提升该值,比如0.3,即30%的chunks被移除的时候才触发rewrite。
storage.local.max-chunks-to-persist
该参数控制等待写入磁盘的chunks的最大个数,如果超过这个数,Prometheus会限制采样的速率,直到这个数降到指定阈值的95%。建议这个值设定为storage.local.memory-chunks的50%。Prometheus会尽力加速存储速度,以避免限流这种情况的发送。
storage.local.num-fingerprint-mutexes
当prometheus server端在进行checkpoint操作或者处理开销较大的查询的时候,采集指标的操作会有短暂的停顿,这是因为prometheus给时间序列分配的mutexes可能不够用,可以通过这个指标来增大预分配的mutexes,有时候可以设置到上万个。
storage.local.series-sync-strategy
控制写入数据之后,何时同步到磁盘,有'never', 'always', 'adaptive'. 同步操作可以降低因为操作系统崩溃带来数据丢失,但是会降低写入数据的性能。
默认为adaptive的策略,即不会写完数据就立刻同步磁盘,会利用操作系统的page cache来批量同步。
storage.local.checkpoint-interval
进行checkpoint的时间间隔,即对尚未写入到磁盘的内存chunks执行checkpoint操作。
参考
Prometheus监控学习笔记之Prometheus的架构及持久化的更多相关文章
- Prometheus监控学习笔记之Prometheus存储
0x00 概述 Prometheus之于kubernetes(监控领域),如kubernetes之于容器编排.随着heapster不再开发和维护以及influxdb 集群方案不再开源,heapster ...
- Prometheus监控学习笔记之prometheus的远端存储
0x00 概述 prometheus在容器云的领域实力毋庸置疑,越来越多的云原生组件直接提供prometheus的metrics接口,无需额外的exporter.所以采用prometheus作为整个集 ...
- Prometheus监控学习笔记之Prometheus不完全避坑指南
0x00 概述 Prometheus 是一个开源监控系统,它本身已经成为了云原生中指标监控的事实标准,几乎所有 k8s 的核心组件以及其它云原生系统都以 Prometheus 的指标格式输出自己的运行 ...
- Prometheus监控学习笔记之Prometheus监控简介
0x00 Prometheus容器监控解决方案 Prometheus(普罗米修斯)是一个开源系统监控和警报工具,最初是在SoundCloud建立的.它是一个独立的开放源码项目,并且独立于任何公司.不同 ...
- Prometheus监控学习笔记之Prometheus的Relabel,SD以及Federation功能
0x00 k8s 的监控设计 k8s 默认以及推荐的监控体系是它自己的一套东西:Heapster + cAdvisor + Influxdb + Grafana,具体可以看 这里 . 包括 k8s 自 ...
- Prometheus监控学习笔记之prometheus的federation机制
0x00 概述 有时候对于一个公司,k8s集群或是所谓的caas只是整个技术体系的一部分,往往这个时候监控系统不仅仅要k8s集群以及k8s中部署的应用,而且要监控传统部署的项目.也就是说整个监控系统不 ...
- Prometheus监控学习笔记之Prometheus普罗米修斯监控入门
0x00 概述 视频讲解通过链接网易云课堂·IT技术快速入门学院进入,更多关于Prometheus的文章. Prometheus是最近几年开始流行的一个新兴监控告警工具,特别是kubernetes的流 ...
- Prometheus监控学习笔记之Prometheus查询无数据或者Grafana不显示数据的诡异问题
0x00 概述 Prometheus和Grafana部署完成后,网络正常,配置文件正常,抓取agent运行正常,使用curl命令获取监控端口数据正常,甚至Prometheus内的targets列表内都 ...
- Prometheus监控学习笔记之Prometheus 2.x版本的常用变化
最近用了prometheus 2.0 版本,感觉改变还是有点大,现将改变相关记录如下: 1.prometheus.yml文件配置修改后,要想重新加载,必须在启动的时候添加参数: --web.enabl ...
随机推荐
- Go包管理工具Vendor使用
一.Go包管理工具Vendor 一.使用步骤 1.首先,从go get -u github.com/kardianos/govendor下载govendor工具到本地. 2.govendor使用时,必 ...
- Redis cluster集群:原理及搭建
Redis cluster集群:原理及搭建 2018年03月19日 16:00:55 阅读数:6120 1.为什么使用redis? redis是一种典型的no-sql 即非关系数据库 像python的 ...
- Java 基础 常用API (System类,Math类,Arrays, BigInteger,)
基本类型包装类 基本类型包装类概述 在实际程序使用中,程序界面上用户输入的数据都是以字符串类型进行存储的.而程序开发中,我们需要把字符串数据,根据需求转换成指定的基本数据类型,如年龄需要转换成int类 ...
- SVM高斯核为何会将特征映射到无穷维?【转载】
转自:https://www.zhihu.com/question/35602879 1.问题: SVM中,对于线性不可分的情况下,我们利用升维,把低维度映射到到维度让数据变得“更可能线性可分”,为了 ...
- [LeetCode] 106. Construct Binary Tree from Postorder and Inorder Traversal_Medium tag: Tree Traversal
Given inorder and postorder traversal of a tree, construct the binary tree. Note:You may assume that ...
- [LeetCode] 788. Rotated Digits_Easy tag: **Dynamic Programming
基本思路建一个helper function, 然后从1-N依次判断是否为good number, 注意判断条件为没有3,4,7 的数字,并且至少有一个2,5,6,9, 否则的话数字就一样了, 比如8 ...
- 工作流引擎--swamp
什么是工作流引擎(Workflow Engine ) 例如开发一个系统最关键的部分不是系统的界面,也不是和数据库之间的信息交换,而是如何根据业务逻辑开发出符合实际需要的程序逻辑并确保其稳定性.易维 ...
- 深入解密.NET(GC垃圾回收)
值类型与引用类型 值类型(Value Type),值类型实例通常分配在线程的堆栈(stack)上,并且不包含任何指向实例数据的指针,因为变量本身就包含了其实例数据 C#的所有值类型均隐式派生自Syst ...
- ubuntu下ldd,查看程序动态库信息
ldd list, dynamic, dependencies linux-vdso.so. => (0x00007ffe9d9b6000) libstdc++.so. => /usr/ ...
- shell基础:数值运算与运算符
linux的shell中,变量的类型默认都是字符串型. export将aa声明为环境变量.也可用declare声明.其实就是改变了-x属性 $(()) 最常用.