查看postgresql的日志show queries log in PostgreSQL?
原文:https://tableplus.io/blog/2018/10/how-to-show-queries-log-in-postgresql.html
--------------------------------------------------
In this post, we are going to discuss how to log all executed queries for inspection later in PostgreSQL.
1. First, you have to enable logging all queries in PostgreSQL.
Please note that only those queries that are executed can be logged.
To do that, you have to config the PostgreSQL configuration file postgresql.conf.
- On Debian-based systems it’s located in
/etc/postgresql/9.3/main/(replace 9.3 with your version of PostgreSQL) - On Red Hat-based systems in
/var/lib/pgsql/data/.
If you still can’t find it, then just type $locate postgresql.conf in terminal, or execute the following SQL query:
SHOW config_file;
Then you need to alter these parameters inside PostgreSQL configuration file.
log_statement = 'all'

log_directory = 'pg_log'

log_filename = 'postgresql-%Y-%m-%d_%H%M%S.log'

logging_collector = on

log_min_error_statement = error
On older versions of PostgreSQL prior to 8.0, replace 'all' with 'true' for the log_statement:
log_statement = 'true'
2. Then restart the server
Run this command:
sudo /etc/init.d/postgresql restart
or this
sudo service postgresql restart
The content of all queries to the server should now appear in the log.
3. See the log
The location of the log file will depend on the configuration.
- On Debian-based systems the default is
/var/log/postgresql/postgresql-9.3-main.log(replace 9.3 with your version of PostgreSQL). - On Red Hat-based systems it is located in
/var/lib/pgsql/data/pg_log/.
Using TablePlus, you can enable the console log via the GUI and see all the queries.
To do that, click on the console log button near the top right panel, or use the shortcut key Cmd + Shift + C.
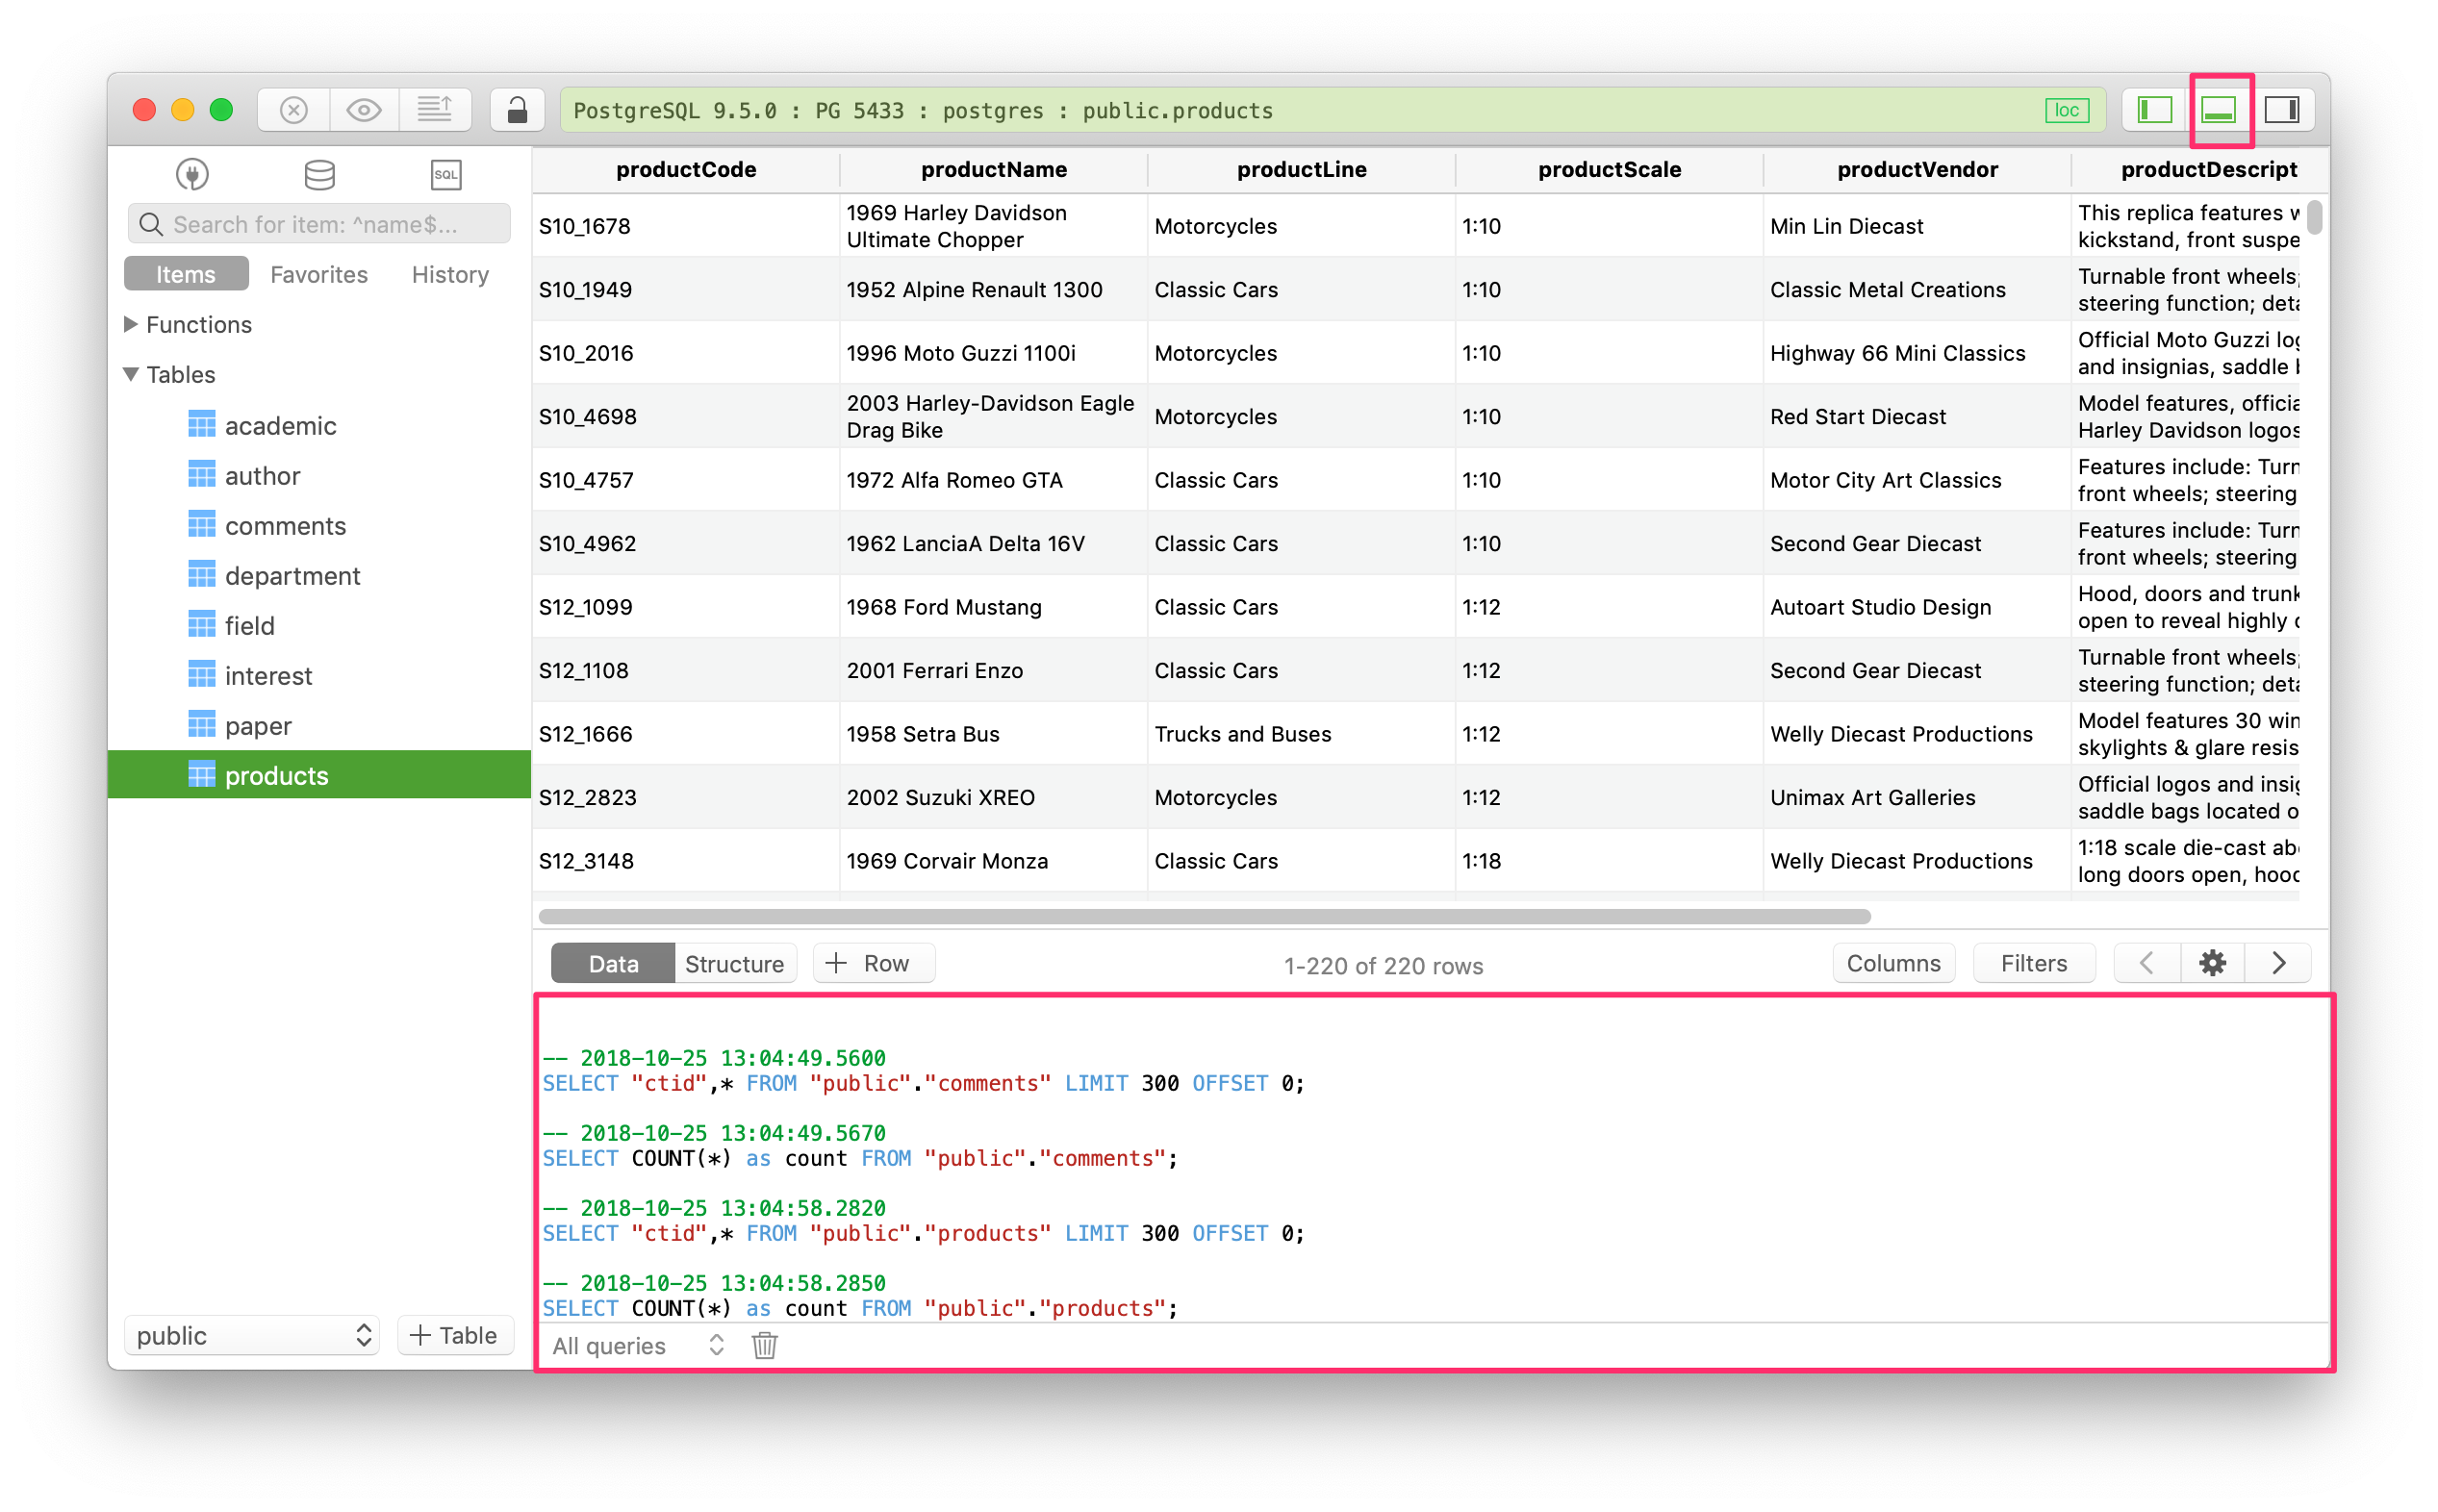
You can also choose to log the meta queries, data queries, or all queries.
New to TablePlus? It’s a modern, native tool with an elegant GUI that allows you to simultaneously manage multiple databases such as MySQL, PostgreSQL, SQLite, Microsoft SQL Server and more.
Download TablePlus here. It’s free anyway!
查看postgresql的日志show queries log in PostgreSQL?的更多相关文章
- 查阅日志文件:有时候报错信息只是给出了问题的表面现象,要想更深入的了解问题,必须查看相应的日志文件,而日志文件又分为系统日志文件(/var/log)和应用的日志文件,结合这两个日志文件,一般就能定位问题所在。
作为一名合格的 Linux 运维工程师,一定要有一套清晰.明确的解决故障思路,当问题出现时,才能迅速定位.解决问题,这里给出一个处理问题的一般思路: 重视报错提示信息:每个错误的出现,都是给出错误提示 ...
- PostgreSQL的日志文件介绍
PostgreSQL的日志文件 pg_log:数据库活动日志(也就是数据库的操作日志): pg_xlog:事务日志: pg_clog:事务状态日志(pg_clog是pg_xlog的辅助日志). 现在主 ...
- MySQL:动态开启慢查询日志(Slow Query Log)
前言 在开发中,高效能的程序 也包括 高效能的查询,所以优化SQL也是程序员必要技能之一.要优化就必须要有慢日志记录才可以知道哪些查询慢,然后反向去修改 慢日志设置方式 写入文件 写入数据库 实践操作 ...
- 如何查看crontab的日志记录
在Unix和类Unix的操作系统之中,crontab命令常用于设置周期性被执行的指令,也可以理解为设置定时任务. crontab中的定时任务有时候没有成功执行,什么原因呢?这时就需要去日志里去分析一下 ...
- linux查看系统的日志的一些实用操作
last -a 把从何处登入系统的主机名称或ip地址,显示在最后一行. -d 指定记录文件.指定记录文件.将IP地址转换成主机名称. -f <记录文件> 指定记录文件. -n <显示 ...
- MySQL 一般查询日志(General Query Log)
与大多数关系型数据库,日志文件是MySQL数据库的一个重要组成部分.MySQL有几种不同的日志文件,通常包括错误日志文件,二进制日志,通用日志.慢查询日志,等等. 这些日志能够帮助我们定位mysqld ...
- 1git命令的使用,查看git仓库状态,添加文件到git跟踪,git提交,查看git分支,查看git仓库日志信息,切换git分支,解决git分支合并后出现冲突的问题
1新建一个存储git的文件夹,命令是: toto@toto-K45VD:~$ mkdir gitfolder 2初始化一个git仓库,命令是: toto@toto-K45VD:~$cd gitfold ...
- linux查看系统的日志------健康检查特性
last https://www.cnblogs.com/anruy/articles/5541675.html Nginx反向代理,健康状态检测,过载保护及配置文件详 ...
- MySQL二进制日志(binary log)总结
本文出处:http://www.cnblogs.com/wy123/p/7182356.html (保留出处并非什么原创作品权利,本人拙作还远远达不到,仅仅是为了链接到原文,因为后续对可能存在的一些错 ...
随机推荐
- Hadoop Join
1. Reduce Join工作原理 Map端的主要工作:为来自不同表或文件的key/value对,打标签以区别不同来源的记录.然后用连接字段作为key,其余部分和新加的标志作为value,最后进行输 ...
- MongoDB 逻辑运算符
逻辑与 $and:要求满足所有查询条件 ,否则返回空 语法:db.集合名.find{ $and: [ { <expression1> }, { <expression2> ...
- Python--一些基础内容
1. Content-Type是什么? Content-Type描述的只是发送端;发送端既可以是服务器也可以是客户端;Content-Type代表发送端发送的实体数据的数据类型.比如:Content- ...
- JDBC(Java项目使用Oracle数据库)
Java项目中使用Oracle数据库(Eclipse) 前言 这学期选了Oracle数据库这门课,于是自己下载了Oracle11gR2版本的数据库.在这之前我一直用的是MySQL.虽然两者教程差不多, ...
- PyCryptodome安装使用方法
PyCryptodome是PyCrypto的一个分支.基于PyCrypto2.6.1,多了以下特性: Authenticated encryption modes (GCM, CCM, EAX, SI ...
- 使用UTF8字符集存储中文生僻字
使用UTF8字符集存储中文生僻字 一.相关学习BLOG https://www.cnblogs.com/jyzhao/p/8654412.html http://blog.itpub.net/7818 ...
- (二十三)JSP指令
一.JSP指令 1.1 JSP指令 JSP指令(directive)是为JSP引擎而设计的,它们并不直接产生任何可见输出,而只是告诉引擎如何处理JSP页面中的其余部分 1.2 在JSP 2.0规范中共 ...
- 安装Docker step by step
1. 系统要求 centos7以上 使用cat /etc/redhat-release查看系统版本,我的Centos 7.6 centos-extra 仓库 enable,默认是打开的 2.安装d ...
- ASP.NET Core 入门(1)(搭建环境CentOS)
一.CentOS 7 安装 下载CentOS http://isoredirect.centos.org/centos/7/isos/x86_64/ 选择其中下载即可. 下载完成后打开vmware准 ...
- 基因组所三代单分子测序PacBio完成技术升级—超长读长助力基因组学研究
基因组所三代单分子测序PacBio完成技术升级—超长读长助力基因组学研究 2015-09-23 | 作者:所级中心基因组平台 张兵 [关闭] 近日,基因组所所级中心基因组平台三代单分子实时测序PacB ...