k8s日志收集方案
k8s日志收集方案
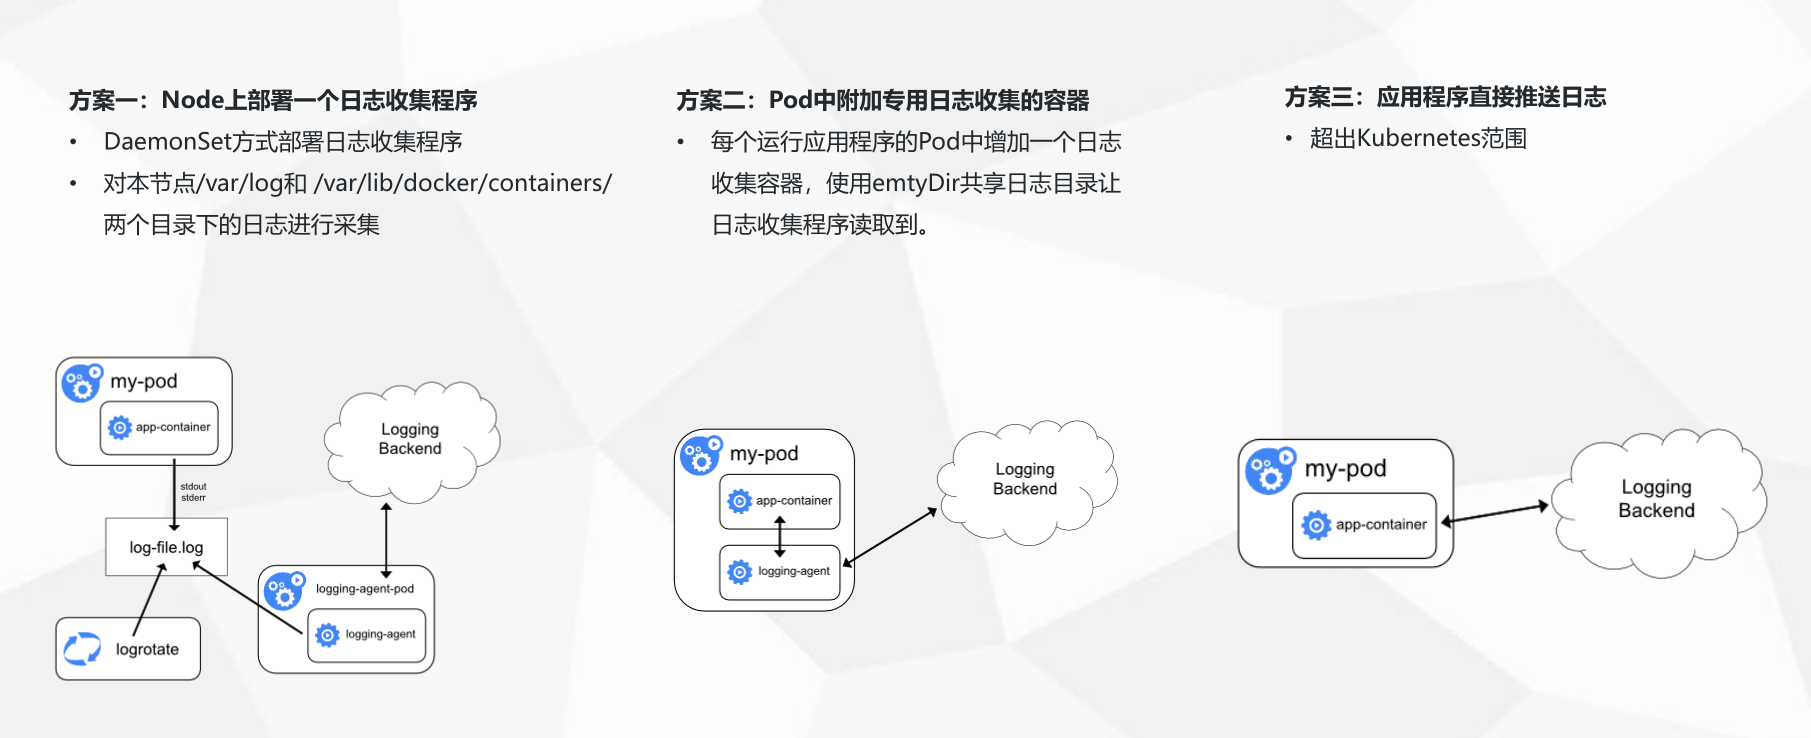
三种收集方案的优缺点:

下面我们就实践第二种日志收集方案:
一、安装ELK
下面直接采用yum的方式安装ELK(源码包安装参考:https://www.cnblogs.com/Dev0ps/p/9309103.html)
1.安装jdk
yum install -y java
2.添加ELK源
cat << EOF >>/etc/yum.repos.d/logstash.repo

[logstash-7.x]

name=Elastic repository for 7.x packages

baseurl=https://artifacts.elastic.co/packages/7.x/yum

gpgcheck=1

gpgkey=https://artifacts.elastic.co/GPG-KEY-elasticsearch

enabled=1

autorefresh=1

type=rpm-md

EOF
3.安装ELK组件
yum install elasticsearch logstash kibana -y
4.修改kibana的配置文件
[root@master ~]# grep -Ev '^$|^#' /etc/kibana/kibana.yml

server.port: 5601

server.host: "0.0.0.0"

elasticsearch.hosts: ["http://localhost:9200"]
5.启动服务
systemctl start elasticsearch

systemctl start kibana
二、收集k8s的日志
1.添加logstash配置文件
input {

  beats {

     port => 5044

  }

}

filter {

}

output {

       if [app] == "k8s" {

        if [type] == "module" {

           elasticsearch {

              hosts => ["http://127.0.0.1:9200"]

              index => "k8s-log-%{+YYYY.MM.dd}"

           }

        }

    }

}
2.启动logstash
/usr/share/logstash/bin/logstash -f /etc/logstash/conf.d/logstash-to-es.conf &
3.创建filebeat的yaml文件
[root@master logs]# cat k8s-logs.yaml

apiVersion: v1

kind: ConfigMap

metadata:

  name: k8s-logs-filebeat-config

  namespace: kube-system

data:

  filebeat.yml: |-

    filebeat.prospectors:

      - type: log

        paths:

          - /messages

        fields:

          app: k8s

          type: module

        fields_under_root: true

    output.logstash:

      hosts: ['172.31.182.140:5044']

---

apiVersion: apps/v1

kind: DaemonSet

metadata:

  name: k8s-logs

  namespace: kube-system

spec:

  selector:

    matchLabels:

      project: k8s

      app: filebeat

  template:

    metadata:

      labels:

        project: k8s

        app: filebeat

    spec:

      containers:

      - name: filebeat

        image: docker.elastic.co/beats/filebeat:6.4.2

        args: [

          "-c", "/etc/filebeat.yml",

          "-e",

        ]

        resources:

          requests:

            cpu: 100m

            memory: 100Mi

          limits:

            cpu: 500m

            memory: 500Mi

        securityContext:

          runAsUser: 0

        volumeMounts:

        - name: filebeat-config

          mountPath: /etc/filebeat.yml

          subPath: filebeat.yml

        - name: k8s-logs

          mountPath: /messages

      volumes:

      - name: k8s-logs

        hostPath:

          path: /var/log/messages

          type: File

      - name: filebeat-config

        configMap:

          name: k8s-logs-filebeat-config
4.创建pod
kubectl apply -f k8s-logs.yaml
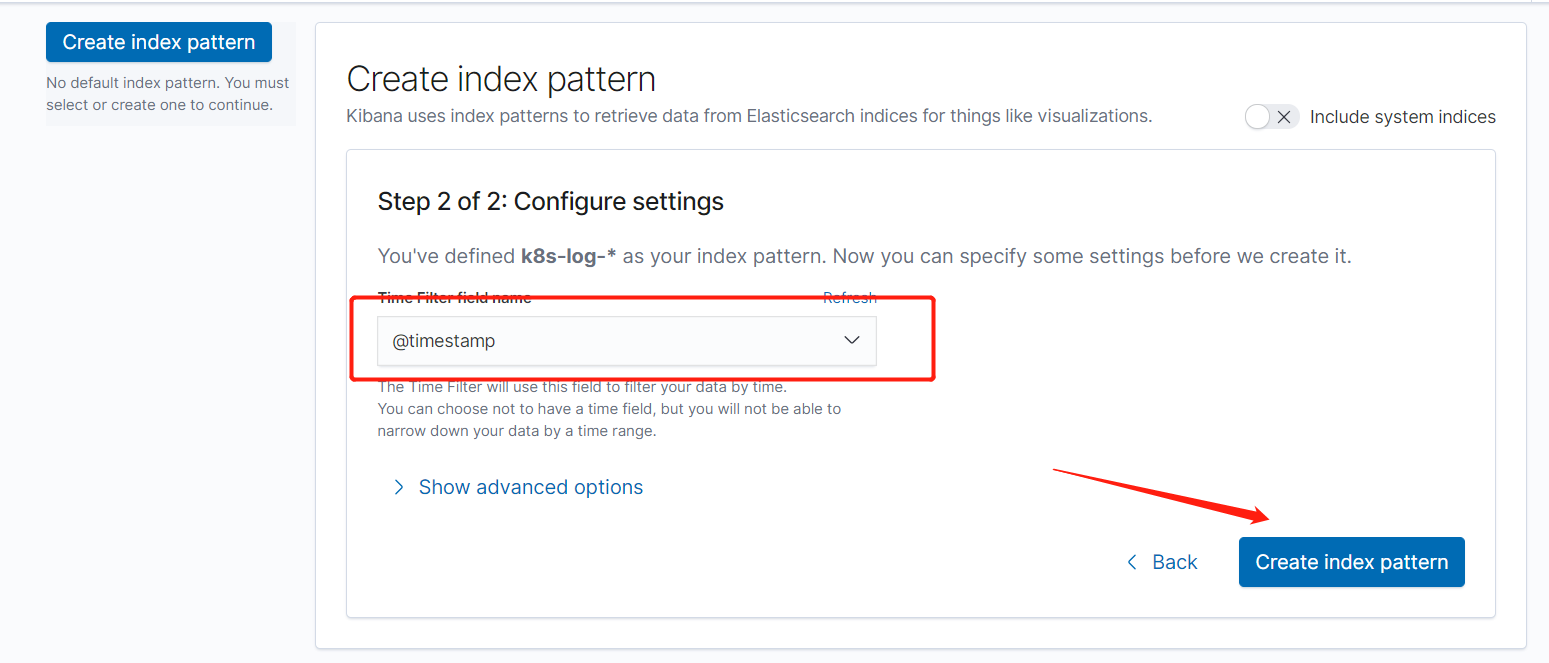
5.kibana添加索引

三、收集nginx日志
1.创建nginx-deployment
默认的日志路径为:/var/log/nginx/
[root@master logs]# cat nginx-deployment.yaml

apiVersion: apps/v1beta1

kind: Deployment

metadata:

  name: nginx-demo

#  namespace: test

spec:

  replicas: 3

  selector:

    matchLabels:

      project: www

      app: www

  template:

    metadata:

      labels:

        project: www

        app: www

    spec:

      imagePullSecrets:

      - name: registry-pull-secret

      containers:

      - name: nginx

        image: nginx:latest

        imagePullPolicy: Always

        ports:

        - containerPort: 80

          name: web

          protocol: TCP

        resources:

          requests:

            cpu: 0.5

            memory: 256Mi

          limits:

            cpu: 1

            memory: 1Gi

        resources:

          requests:

            cpu: 0.5

            memory: 256Mi

          limits:

            cpu: 1

            memory: 1Gi

        livenessProbe:

          httpGet:

            path: /index.html

            port: 80

          initialDelaySeconds: 6

          timeoutSeconds: 20

        volumeMounts:

        - name: nginx-logs

          mountPath: /var/log/nginx/

      - name: filebeat

        image: docker.elastic.co/beats/filebeat:6.4.2

        args: [

          "-c", "/etc/filebeat.yml",

          "-e",

        ]

        resources:

          limits:

            memory: 500Mi

          requests:

            cpu: 100m

            memory: 100Mi

        securityContext:

          runAsUser: 0

        volumeMounts:

        - name: filebeat-config

          mountPath: /etc/filebeat.yml

          subPath: filebeat.yml

        - name: nginx-logs

          mountPath: /var/log/nginx/

      volumes:

      - name: nginx-logs

        emptyDir: {}

      - name: filebeat-config

        configMap:

          name: filebeat-nginx-config
2.创建filebest收集日志
[root@master logs]# cat filebeat-nginx-configmap.yaml

apiVersion: v1

kind: ConfigMap

metadata:

  name: filebeat-nginx-config

#  namespace: test

data:

  filebeat.yml: |-

    filebeat.prospectors:

      - type: log

        paths:

          - /var/log/nginx/access.log

        # tags: ["access"]

        fields:

          app: www

          type: nginx-access

        fields_under_root: true

      - type: log

        paths:

          - /var/log/nginx/error.log

        # tags: ["error"]

        fields:

          app: www

          type: nginx-error

        fields_under_root: true

    output.logstash:

      hosts: ['172.31.182.140:5044']
3.添加logstas配置
[root@master logs]# cat /etc/logstash/conf.d/logstash-to-es.conf

input {

  beats {

     port => 5044

  }

}

filter {

}

output {

    if [app] == "www" {

        if [type] == "nginx-access" {

           elasticsearch {

              hosts => ["http://127.0.0.1:9200"]

              index => "nginx-access-%{+YYYY.MM.dd}"

           }

        }

        else if [type] == "nginx-error" {

           elasticsearch {

              hosts => ["http://127.0.0.1:9200"]

              index => "nginx-error-%{+YYYY.MM.dd}"

           }

        }

    } else if [app] == "k8s" {

        if [type] == "module" {

           elasticsearch {

              hosts => ["http://127.0.0.1:9200"]

              index => "k8s-log-%{+YYYY.MM.dd}"

           }

        }

    }

#  stdout { codec=> rubydebug }

}
4.kibana添加索引
四、收集tomcat日志
1.1.创建tomcat-deployment
默认的日志路径为:/usr/local/tomcat/logs
[root@master logs]# cat tomcat-deployment.yaml

apiVersion: apps/v1beta1

kind: Deployment

metadata:

  name: tomcat-java-demo

#  namespace: test

spec:

  replicas: 3

  selector:

    matchLabels:

      project: www

      app: www

  template:

    metadata:

      labels:

        project: www

        app: www

    spec:

      imagePullSecrets:

      - name: registry-pull-secret

      containers:

      - name: tomcat

        image: tomcat:latest

        imagePullPolicy: Always

        ports:

        - containerPort: 8080

          name: web

          protocol: TCP

        resources:

          requests:

            cpu: 0.5

            memory: 1Gi

          limits:

            cpu: 1

            memory: 2Gi

        livenessProbe:

          httpGet:

            path: /

            port: 8080

          initialDelaySeconds: 60

          timeoutSeconds: 20

        readinessProbe:

          httpGet:

            path: /

            port: 8080

          initialDelaySeconds: 60

          timeoutSeconds: 20

        volumeMounts:

        - name: tomcat-logs

          mountPath: /usr/local/tomcat/logs

      - name: filebeat

        image: docker.elastic.co/beats/filebeat:6.4.2

        args: [

          "-c", "/etc/filebeat.yml",

          "-e",

        ]

        resources:

          limits:

            memory: 500Mi

          requests:

            cpu: 100m

            memory: 100Mi

        securityContext:

          runAsUser: 0

        volumeMounts:

        - name: filebeat-config

          mountPath: /etc/filebeat.yml

          subPath: filebeat.yml

        - name: tomcat-logs

          mountPath: /usr/local/tomcat/logs

      volumes:

      - name: tomcat-logs

        emptyDir: {}

      - name: filebeat-config

        configMap:

          name: filebeat-config
2.创建filebest收集tomcat日志
[root@master logs]# cat filebeat-tomcat-configmap.yaml

apiVersion: v1

kind: ConfigMap

metadata:

  name: filebeat-config

#  namespace: test

data:

  filebeat.yml: |-

    filebeat.prospectors:

    - type: log

      paths:

        - /usr/local/tomcat/logs/catalina.*

      # tags: ["tomcat"]

      fields:

        app: www

        type: tomcat-catalina

      fields_under_root: true

      multiline:

        pattern: '^\['

        negate: true

        match: after

    output.logstash:

      hosts: ['172.31.182.140:5044']
3.添加logstas配置后重启
[root@master logs]# cat /etc/logstash/conf.d/logstash-to-es.conf

input {

  beats {

     port => 5044

  }

}

filter {

}

output {

    if [app] == "www" {

        if [type] == "nginx-access" {

           elasticsearch {

              hosts => ["http://127.0.0.1:9200"]

              index => "nginx-access-%{+YYYY.MM.dd}"

           }

        }

        else if [type] == "nginx-error" {

           elasticsearch {

              hosts => ["http://127.0.0.1:9200"]

              index => "nginx-error-%{+YYYY.MM.dd}"

           }

        }

        else if [type] == "tomcat-catalina" {

           elasticsearch {

              hosts => ["http://127.0.0.1:9200"]

              index => "tomcat-catalina-%{+YYYY.MM.dd}"

           }

        }

    } else if [app] == "k8s" {

        if [type] == "module" {

           elasticsearch {

              hosts => ["http://127.0.0.1:9200"]

              index => "k8s-log-%{+YYYY.MM.dd}"

           }

        }

    }

#  stdout { codec=> rubydebug }

}
4.kibana添加索引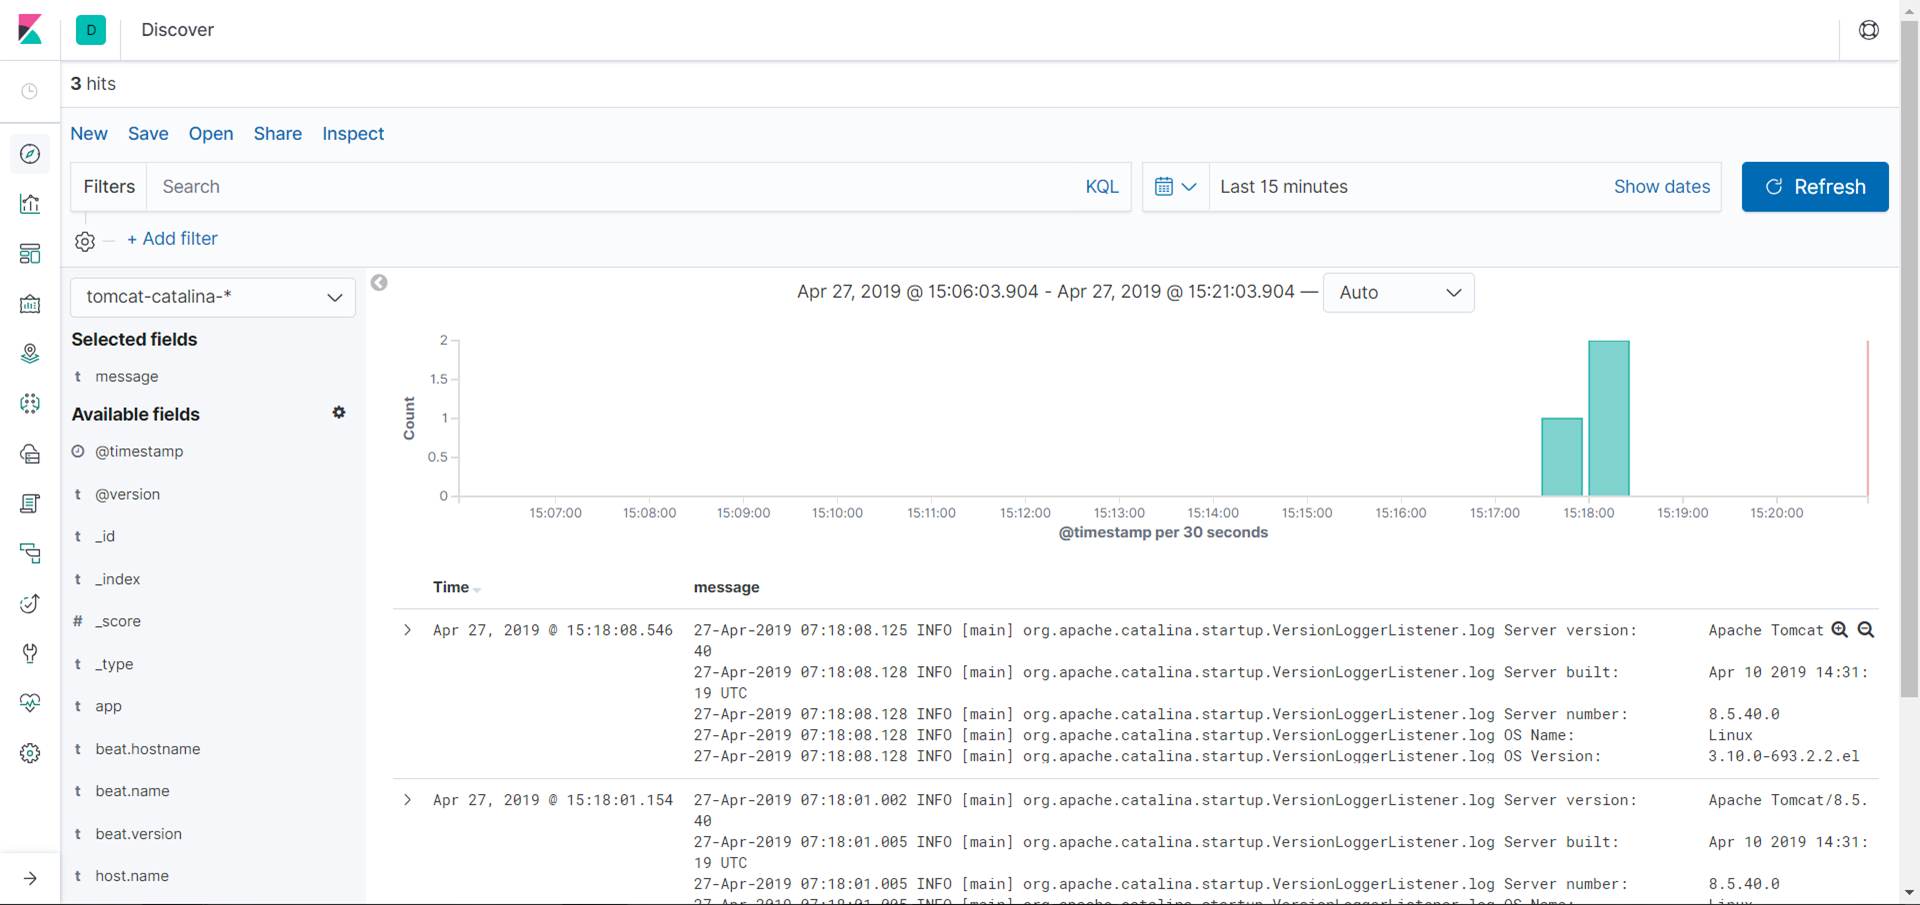
k8s日志收集方案的更多相关文章
- k8s 日志收集之 EFK
如今越来越多的应用部署在容器之中,如何收集日志也是一个很重要的问题.服务出问题了,排查问题需要给开发看日志.服务一般会在多个不同的 pod 中,一个一个的登进去看也的确不方便.业务数据统计也需要日志. ...
- K8S学习笔记之k8s日志收集实战
0x00 简介 本文主要介绍在k8s中收集应用的日志方案,应用运行中日志,一般情况下都需要收集存储到一个集中的日志管理系统中,可以方便对日志进行分析统计,监控,甚至用于机器学习,智能分析应用系统问题, ...
- Kubernetes 常用日志收集方案
Kubernetes 常用日志收集方案 学习了 Kubernetes 集群中监控系统的搭建,除了对集群的监控报警之外,还有一项运维工作是非常重要的,那就是日志的收集. 介绍 应用程序和系统日志可以帮助 ...
- docker容器日志收集方案汇总评价总结
docker日志收集方案有太多,下面截图罗列docker官方给的日志收集方案(详细请转docker官方文档).很多方案都不适合我们下面的系列文章没有说. 经过以下5篇博客的叙述简单说下docker容器 ...
- docker容器日志收集方案(方案N,其他中间件传输方案)
由于docker虚拟化的特殊性导致日志收集方案的多样性和复杂性下面接收几个可能的方案 这个方案各大公司都在用只不过传输方式大同小异 中间件使用kafka是肯定的,kafka的积压与吞吐能力相当强悍 ...
- k8s日志收集及存档
k8s日志收集架构图 利用阿里开源的工具log-pilot,往kafka内写日志,然后吐一份至es,另外一份用flume消费kafka数据落盘
- k8s日志收集配置
容器日志样例 172.101.32.1 - - [03/Jun/2019:17:14:10 +0800] "POST /ajaxVideoQueues!queryAllUser.action ...
- 轻量级日志收集方案Loki
先看看结果有多轻量吧 官方文档:https://grafana.com/docs/loki/latest/ 简介 Grafana Loki 是一个日志聚合工具,它是功能齐全的日志堆栈的核心. Loki ...
- golang日志收集方案之ELK
每个系统都有日志,当系统出现问题时,需要通过日志解决问题 当系统机器比较少时,登陆到服务器上查看即可满足 当系统机器规模巨大,登陆到机器上查看几乎不现实 当然即使是机器规模不大,一个系统通常也会涉及到 ...
随机推荐
- ASP.NET MVC中的路由IRouteConstraint方法应用实例
在如下代码的写法中: public class RouteConfig { public static void RegisterRoutes(RouteCollection routes) { ro ...
- 3D Lut 电影级调色算法 附完整C代码
在前面的文章,我提到过VSCO Cam 的胶片滤镜算法实现是3d lut. 那么3d lut 到底是个什么东西呢? 或者说它是用来做什么的? 长话短说,3d lut(全称 : 3D Lookup t ...
- HTML学习笔记:1.基础概念
①HTML:Hypertext Markup Language,即超文本标记语言,文件由标记组成 ②HTML发展史 (几个重要节点): 1993(IETF):HTML 1.0 1995(W3C): ...
- 14.Ubuntu基本命令
vi编辑器 { :上一段diamante } :下一段代码 dw: 删除一个单词 权限 前面的分三组 第一: 文件拥有者的权限 第二:同组者拥有的权限 第三:其他人拥有的权限 前面“-”表示是文件 ...
- Docker 跨主机网络方案分析
PS:文章首发公众号,欢迎大家关注我的公众号:aCloudDeveloper,专注技术分享,努力打造干货分享平台,二维码在文末可以扫,谢谢大家. 上篇文章介绍了容器网络的单主机网络,本文将进一步介绍多 ...
- Android 样式的开发(转)
Android(2) 目录(?)[-] rectangle oval line ring layer-list篇 普通图片 bitmap标签 点九图片 nine-patch标签 color标签 ...
- Linux内核调试方法
内核配置选项中要使能CONFIG_MAGIC_SYSRQ选项,这样系统启动之后,会生成/proc/sysrq-trigger节点用于调试. 其次,可以在/etc/sysctl.conf中设置kerne ...
- cmd连接Oracle数据库成功后输入sql语句返回 2
解决办法 : sql语句后一定要跟分号 .
- 并发库应用之十二 & 常用集合问题汇总
1. List遍历时修改报错 别的先什么都不说,直接上代码看看就知道了: public class ListTest { public static void main(String[] args) ...
- ZooKeeper的使用---Java程序
一.导入库 以下库存放在目录lib中: audience-annotations-0.5.0.jar jline-0.9.94.jar log4j-1.2.17.jar netty-3.10.6.Fi ...