[Python] Statistical analysis of time series
Global Statistics:
Common seen methods as such
1. Mean
2. Median
3. Standard deviation: the larger the number means it various a lot.
4. Sum.
Rolling Statistics:
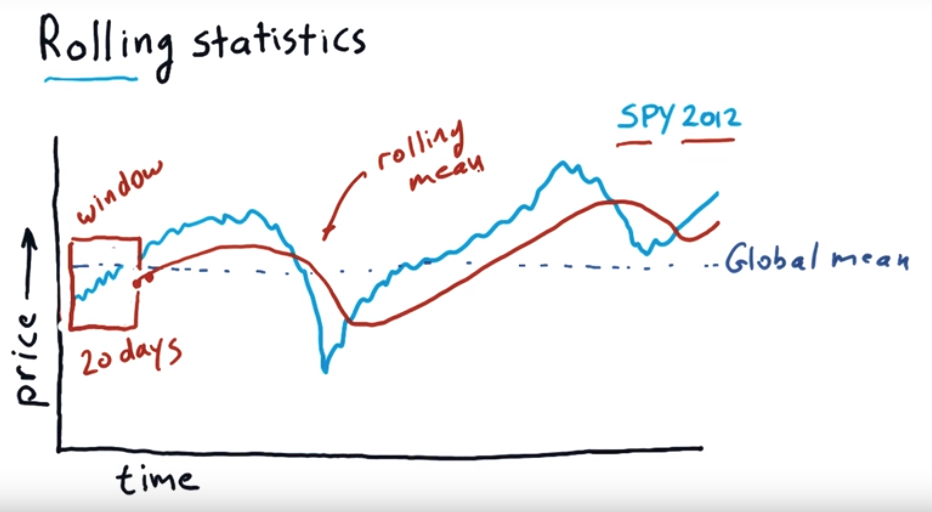
It use a time window, moving forward each day to calculate the mean value of those window periods.
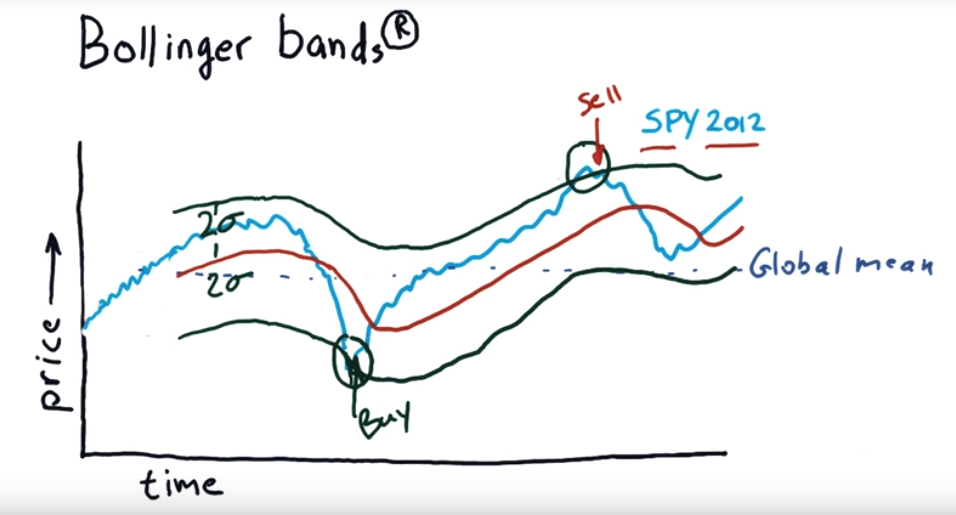
To find which day is good to buy which day is good for sell, we can use Bollinger bands.
Bollinger bands:
- import os
- import pandas as pd
- import matplotlib.pyplot as plt
- def test_run():
- start_date='2017-01-01'
- end_data='2017-12-15'
- dates=pd.date_range(start_date, end_data)
- # Create an empty data frame
- df=pd.DataFrame(index=dates)
- symbols=['SPY', 'AAPL', 'IBM', 'GOOG', 'GLD']
- for symbol in symbols:
- temp=getAdjCloseForSymbol(symbol)
- df=df.join(temp, how='inner')
- return df
- if __name__ == '__main__':
- df=test_run()
- # data=data.ix['2017-12-01':'2017-12-15', ['IBM', 'GOOG']]
- # df=normalize_data(df)
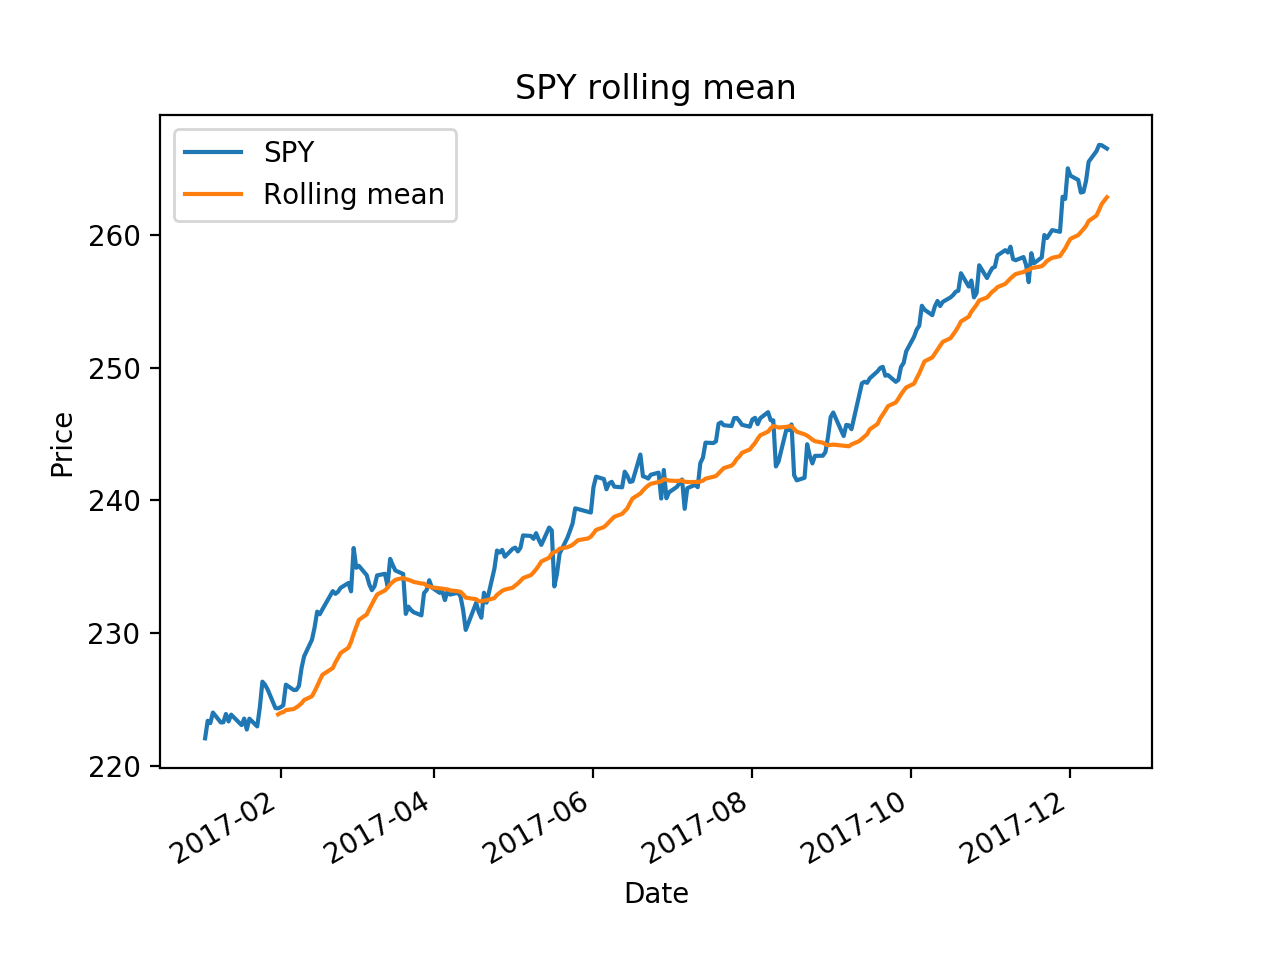
- ax = df['SPY'].plot(title="SPY rolling mean", label='SPY')
- rm = df['SPY'].rolling(20).mean()
- rm.plot(label='Rolling mean', ax=ax)
- ax.set_xlabel('Date')
- ax.set_ylabel('Price')
- ax.legend(loc="upper left")
- plt.show()
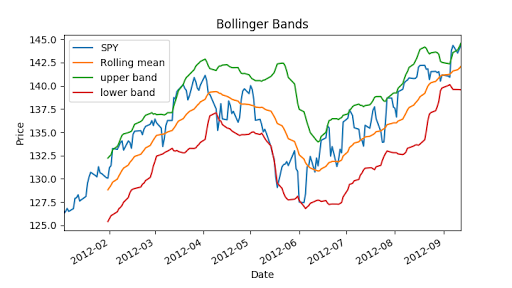
Now we can calculate Bollinger bands, it is 2 times std value.
- """Bollinger Bands."""
- import os
- import pandas as pd
- import matplotlib.pyplot as plt
- def symbol_to_path(symbol, base_dir="data"):
- """Return CSV file path given ticker symbol."""
- return os.path.join(base_dir, "{}.csv".format(str(symbol)))
- def get_data(symbols, dates):
- """Read stock data (adjusted close) for given symbols from CSV files."""
- df = pd.DataFrame(index=dates)
- if 'SPY' not in symbols: # add SPY for reference, if absent
- symbols.insert(0, 'SPY')
- for symbol in symbols:
- df_temp = pd.read_csv(symbol_to_path(symbol), index_col='Date',
- parse_dates=True, usecols=['Date', 'Adj Close'], na_values=['nan'])
- df_temp = df_temp.rename(columns={'Adj Close': symbol})
- df = df.join(df_temp)
- if symbol == 'SPY': # drop dates SPY did not trade
- df = df.dropna(subset=["SPY"])
- return df
- def plot_data(df, title="Stock prices"):
- """Plot stock prices with a custom title and meaningful axis labels."""
- ax = df.plot(title=title, fontsize=12)
- ax.set_xlabel("Date")
- ax.set_ylabel("Price")
- plt.show()
- def get_rolling_mean(values, window):
- """Return rolling mean of given values, using specified window size."""
- return values.rolling(window=window).mean()
- def get_rolling_std(values, window):
- """Return rolling standard deviation of given values, using specified window size."""
- # TODO: Compute and return rolling standard deviation
- return values.rolling(window=window).std()
- def get_bollinger_bands(rm, rstd):
- """Return upper and lower Bollinger Bands."""
- # TODO: Compute upper_band and lower_band
- upper_band = rstd * 2 + rm
- lower_band = rm - rstd * 2
- return upper_band, lower_band
- def test_run():
- # Read data
- dates = pd.date_range('2012-01-01', '2012-12-31')
- symbols = ['SPY']
- df = get_data(symbols, dates)
- # Compute Bollinger Bands
- # 1. Compute rolling mean
- rm_SPY = get_rolling_mean(df['SPY'], window=20)
- # 2. Compute rolling standard deviation
- rstd_SPY = get_rolling_std(df['SPY'], window=20)
- # 3. Compute upper and lower bands
- upper_band, lower_band = get_bollinger_bands(rm_SPY, rstd_SPY)
- # Plot raw SPY values, rolling mean and Bollinger Bands
- ax = df['SPY'].plot(title="Bollinger Bands", label='SPY')
- rm_SPY.plot(label='Rolling mean', ax=ax)
- upper_band.plot(label='upper band', ax=ax)
- lower_band.plot(label='lower band', ax=ax)
- # Add axis labels and legend
- ax.set_xlabel("Date")
- ax.set_ylabel("Price")
- ax.legend(loc='upper left')
- plt.show()
- if __name__ == "__main__":
- test_run()
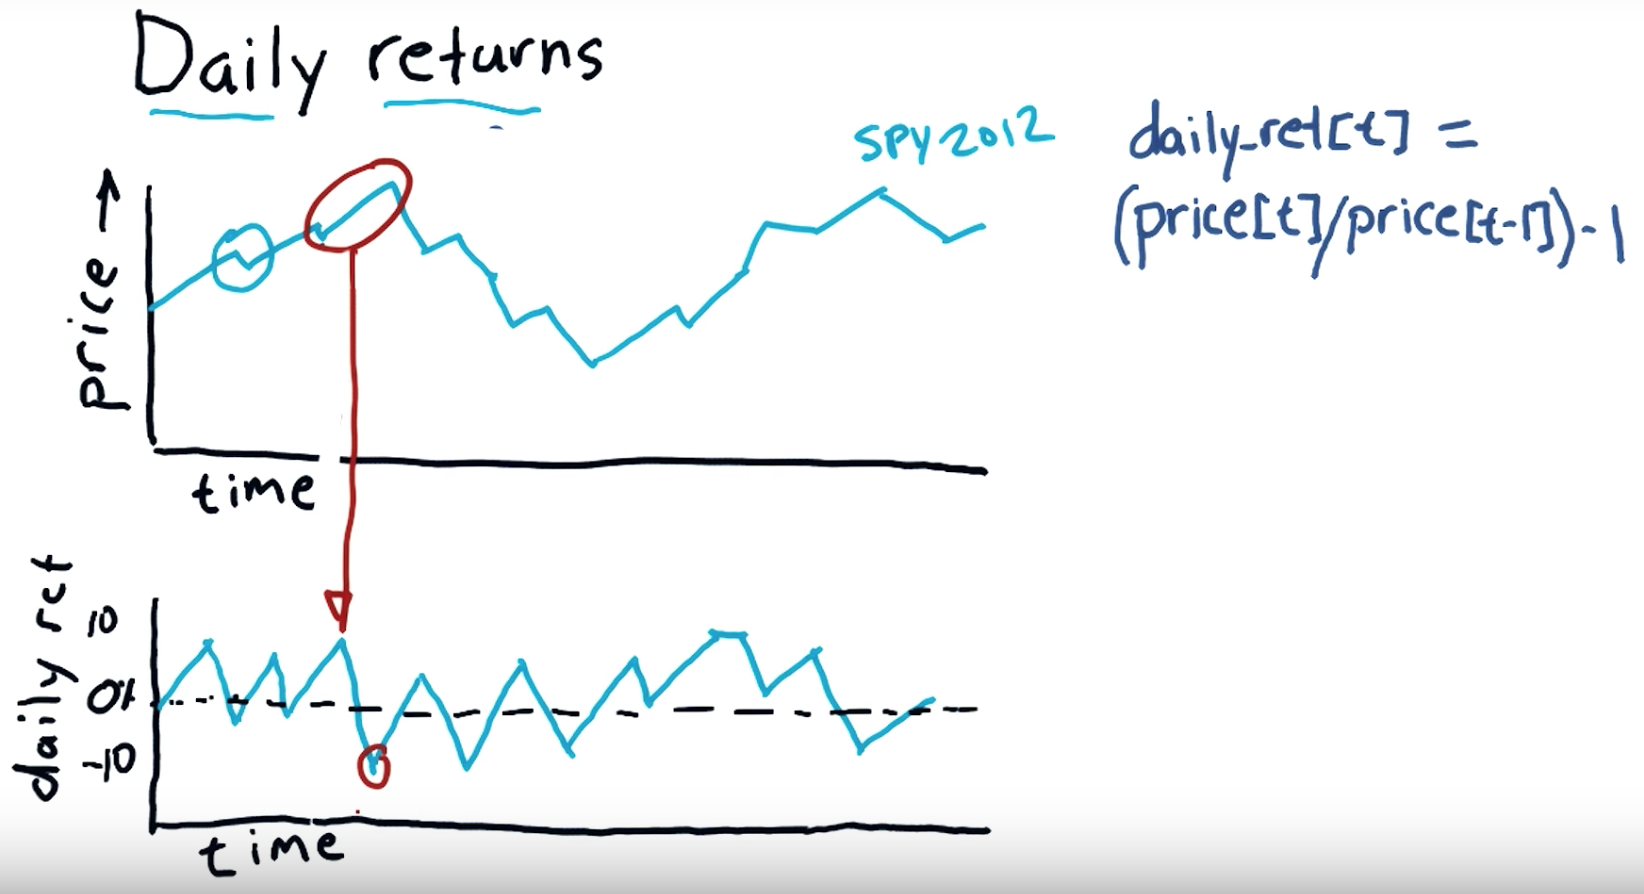
Daily return:
Subtract the previous day's closing price from the most recent day's closing price. In this example, subtract $35.50 from $36.75 to get $1.25. Divide your Step 4 result by the previous day's closing price to calculate the daily return. Multiply this result by 100 to convert it to a percentage.
- """Compute daily returns."""
- import os
- import pandas as pd
- import matplotlib.pyplot as plt
- def symbol_to_path(symbol, base_dir="data"):
- """Return CSV file path given ticker symbol."""
- return os.path.join(base_dir, "{}.csv".format(str(symbol)))
- def get_data(symbols, dates):
- """Read stock data (adjusted close) for given symbols from CSV files."""
- df = pd.DataFrame(index=dates)
- if 'SPY' not in symbols: # add SPY for reference, if absent
- symbols.insert(0, 'SPY')
- for symbol in symbols:
- df_temp = pd.read_csv(symbol_to_path(symbol), index_col='Date',
- parse_dates=True, usecols=['Date', 'Adj Close'], na_values=['nan'])
- df_temp = df_temp.rename(columns={'Adj Close': symbol})
- df = df.join(df_temp)
- if symbol == 'SPY': # drop dates SPY did not trade
- df = df.dropna(subset=["SPY"])
- return df
- def plot_data(df, title="Stock prices", xlabel="Date", ylabel="Price"):
- """Plot stock prices with a custom title and meaningful axis labels."""
- ax = df.plot(title=title, fontsize=12)
- ax.set_xlabel(xlabel)
- ax.set_ylabel(ylabel)
- plt.show()
- def compute_daily_returns(df):
- """Compute and return the daily return values."""
- # TODO: Your code here
- # Note: Returned DataFrame must have the same number of rows
- return df / df.shift(-1) -1
- def test_run():
- # Read data
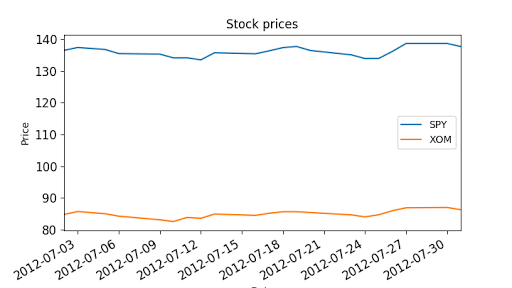
- dates = pd.date_range('2012-07-01', '2012-07-31') # one month only
- symbols = ['SPY','XOM']
- df = get_data(symbols, dates)
- plot_data(df)
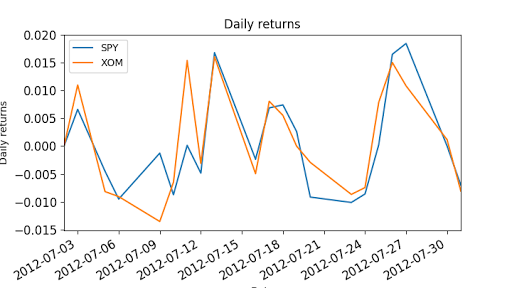
- # Compute daily returns
- daily_returns = compute_daily_returns(df)
- plot_data(daily_returns, title="Daily returns", ylabel="Daily returns")
- if __name__ == "__main__":
- test_run()
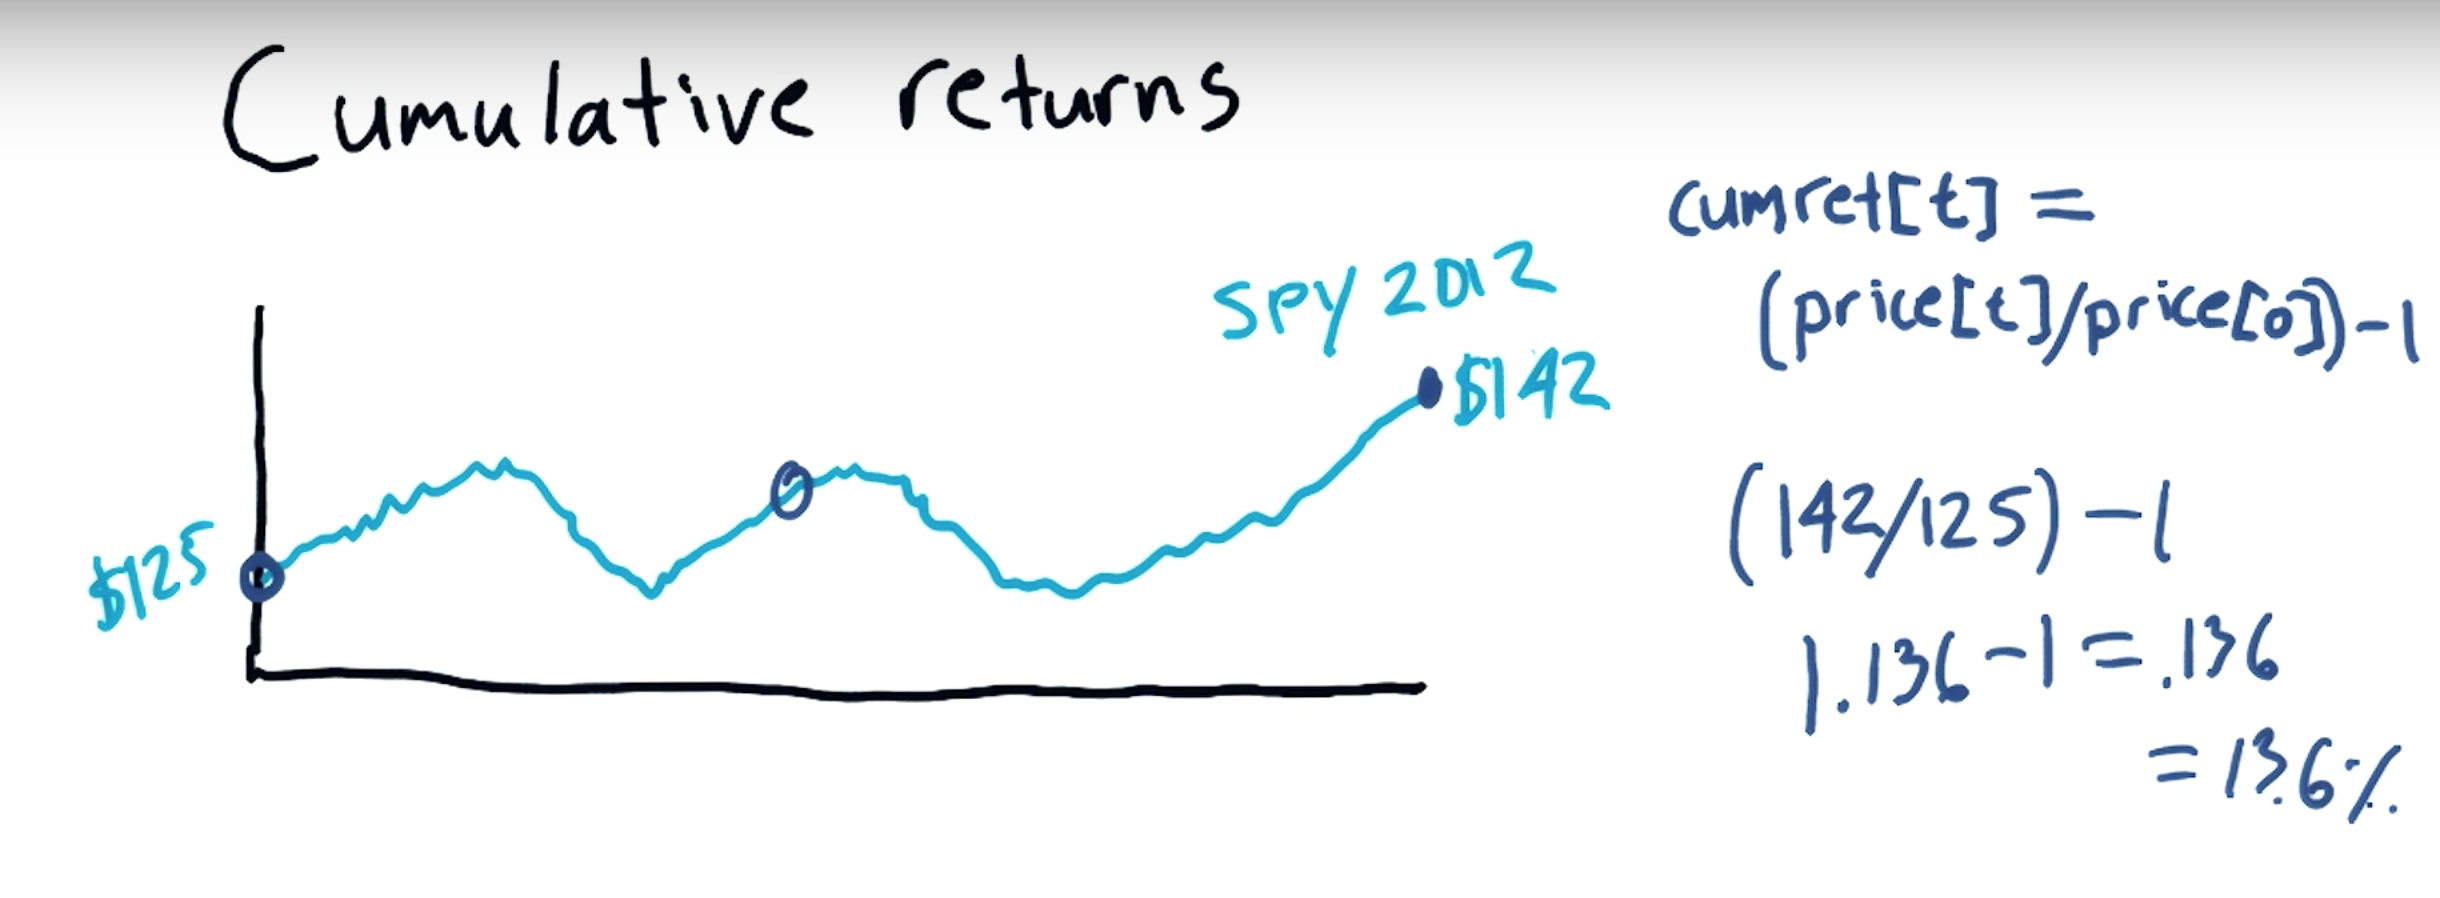
Cumulative return:
an investment relative to the principal amount invested over a specified amount of time. ... To calculate cumulative return, subtract the original price of the investment from the current price and divide that difference by the original price.
[Python] Statistical analysis of time series的更多相关文章
- How-to: Do Statistical Analysis with Impala and R
sklearn实战-乳腺癌细胞数据挖掘(博客主亲自录制视频教程) https://study.163.com/course/introduction.htm?courseId=1005269003&a ...
- python data analysis | python数据预处理(基于scikit-learn模块)
原文:http://www.jianshu.com/p/94516a58314d Dataset transformations| 数据转换 Combining estimators|组合学习器 Fe ...
- python学习笔记—DataFrame和Series的排序
更多大数据分析.建模等内容请关注公众号<bigdatamodeling> ################################### 排序 ################## ...
- Should You Build Your Own Backtester?
By Michael Halls-Moore on August 2nd, 2016 This post relates to a talk I gave in April at QuantCon 2 ...
- Python数据分析工具:Pandas之Series
Python数据分析工具:Pandas之Series Pandas概述Pandas是Python的一个数据分析包,该工具为解决数据分析任务而创建.Pandas纳入大量库和标准数据模型,提供高效的操作数 ...
- 用 Python 通过马尔可夫随机场(MRF)与 Ising Model 进行二值图降噪
前言 这个降噪的模型来自 Christopher M. Bishop 的 Pattern Recognition And Machine Learning (就是神书 PRML……),问题是如何对一个 ...
- 大数据分析与机器学习领域Python兵器谱
http://www.thebigdata.cn/JieJueFangAn/13317.html 曾经因为NLTK的缘故开始学习Python,之后渐渐成为我工作中的第一辅助脚本语言,虽然开发语言是C/ ...
- Machine and Deep Learning with Python
Machine and Deep Learning with Python Education Tutorials and courses Supervised learning superstiti ...
- Python 网页爬虫 & 文本处理 & 科学计算 & 机器学习 & 数据挖掘兵器谱(转)
原文:http://www.52nlp.cn/python-网页爬虫-文本处理-科学计算-机器学习-数据挖掘 曾经因为NLTK的缘故开始学习Python,之后渐渐成为我工作中的第一辅助脚本语言,虽然开 ...
随机推荐
- 前端学习之路——gulp篇
一.构建gulp环境 1.下载nodejs gulp基于node.js,要通过nodejs的npm安装gulp,所以要先安装node.js环境.(英文官网/中文官网链接). 通过cmd命令窗口确定安装 ...
- RocketMQ学习笔记(6)----RocketMQ的Client的使用 Producer/Consumer
1. 添加依赖 pom.xml如下: <dependency> <groupId>org.apache.rocketmq</groupId> <artifa ...
- 网页结构的简介和Xpath语法的入门教程
相信很多小伙伴已经听说过Xpath,之前小编也写过一篇关于Xpath的文章,感兴趣的小伙伴可以戳这篇文章如何利用Xpath抓取京东网商品信息以及Python网络爬虫四大选择器(正则表达式.BS4.Xp ...
- (转)JVM内存管理-----堆内存
来源:http://blog.csdn.net/yu422560654/article/details/7952613 Heap堆内存理解 一个JVM实例只有一个堆内存,堆内存的大小是可以调节的.类加 ...
- JavaScript函数练习
1. 判断一个数是否是素数 function isSushu (n) { n = n || 0; var isSu = true; for (var i = 2; i <= Math.sqrt( ...
- YUM安装MONGODB发生Error in PREIN scriptlet in rpm package mongodb-enterprise-server-4.0.2-1.el6.x86_64错误
YUM安装MONGODB发生Error in PREIN scriptlet in rpm package mongodb-enterprise-server-4.0.2-1.el6.x86_64错误 ...
- 使用vuex的流程随笔
1.在建好的vue项目中新建一个vuex文件夹在此文件夹下建一个index.js文件,在此文件下引入vuex 模块(当然需要先npm下载)和vue模块,在引入你所有的自定义的module.js模块(下 ...
- Spring 整合Shiro:记住我
1.登录方法 /** * 执行登录操作 * * @param username * @param password * @param rememberMe * @param model * @retu ...
- makefile编写helloworld
相信在unix下编程的没有不知道makefile的,刚开始学习unix平台 下的东西,了解了下makefile的制作,觉得有点东西可以记录下. 下面是一个极其简单的例子: 现在我要编译一个Hello ...
- 【图灵杯 A】谷神的赌博游戏
[题目链接]:http://oj.acmclub.cn/problem.php?cid=1164&pid=0 [题意] [题解] 把每个数字都%3处理; 会发现最后1的个数为n+1 2和0的个 ...