6.监控elasticsearch集群---放弃采用(获取不到数据),建议看另一篇文章:监控elasticsearch
prometheus监控es,同样采用exporter的方案。
- 项目地址:
- elasticsearch_exporter:https://github.com/justwatchcom/elasticsearch_exporter
1、安装部署
现有es三节点的集群,环境大概如下:
| 主机 | 组件 |
|---|---|
| 192.168.75.11 | prometheus |
| 192.168.75.21 | es,kibana,nginx |
接着分别在如上三台主机上进行如下配置:
wget https://github.com/justwatchcom/elasticsearch_exporter/releases/download/v1.1.0/elasticsearch_exporter-1.1.0.linux-amd64.tar.gz

tar -zxv -f elasticsearch_exporter-1.1.0.linux-amd64.tar.gz

mv elasticsearch_exporter-1.1.0.linux-amd64 /usr/local/elasticsearch_exporter
创建用户等
groupadd prometheus

useradd -g prometheus -m -d /var/lib/prometheus -s /sbin/nologin prometheus

chown -R prometheus.prometheus /usr/local/elasticsearch_exporter
启动监控客户端:
nohup ./elasticsearch_exporter --web.listen-address ":9308" --es.uri http://192.168.75.21:9200 &
使用systemd管理:
cat /lib/systemd/system/es_exporter.service

[Unit]

Description=The es_exporter

After=network.target

[Service]

Type=simple

User=prometheus

ExecStart=/usr/local/elasticsearch_exporter/elasticsearch_exporter --web.listen-address ":9308" --es.uri http://192.168.75.21:9200

Restart=on-failure

[Install]

WantedBy=multi-user.target
启动:
systemctl daemon-reload

systemctl start es_exporter

systemctl enable es_exporter
查看metrics:
curl 127.0.0.1:9308/metrics
2,配置 prometheus.yml 添加监控目标
vim /usr/local/prometheus/prometheus.yml

  - job_name: 'elasticsearch'

    scrape_interval: 60s

    scrape_timeout:  30s

    metrics_path: "/metrics"

    static_configs:

    - targets: ['192.168.75.21:9308']

      labels:

       service: elasticsearch
重启服务。
systemctl restart prometheus
或者通过命令热加载:
curl -XPOST localhost:9090/-/reload
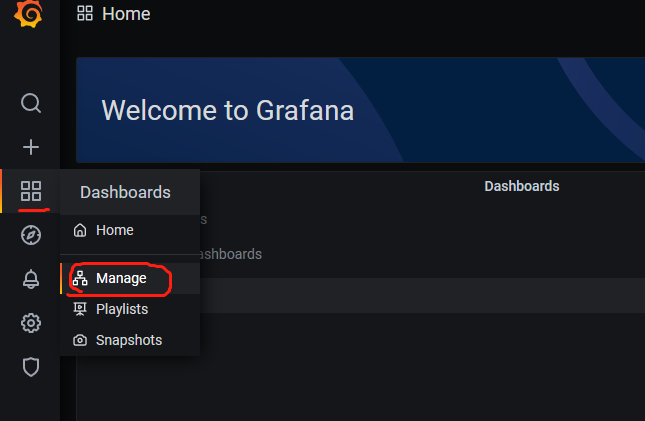
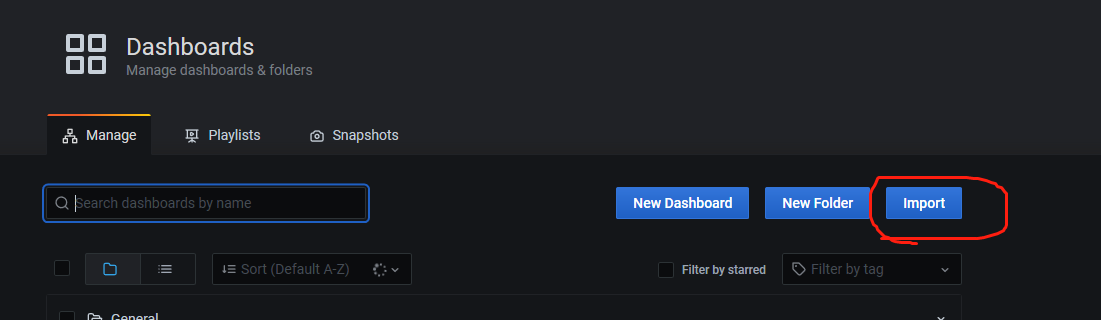
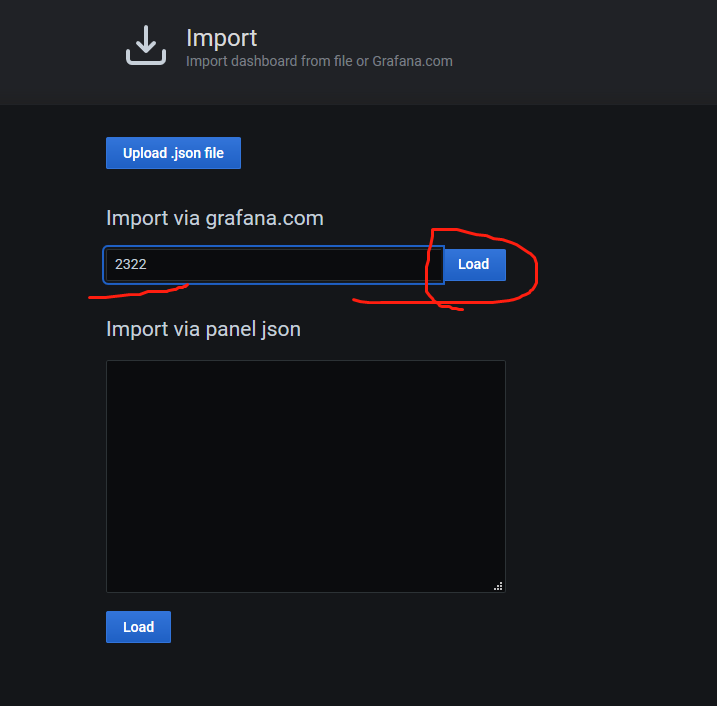
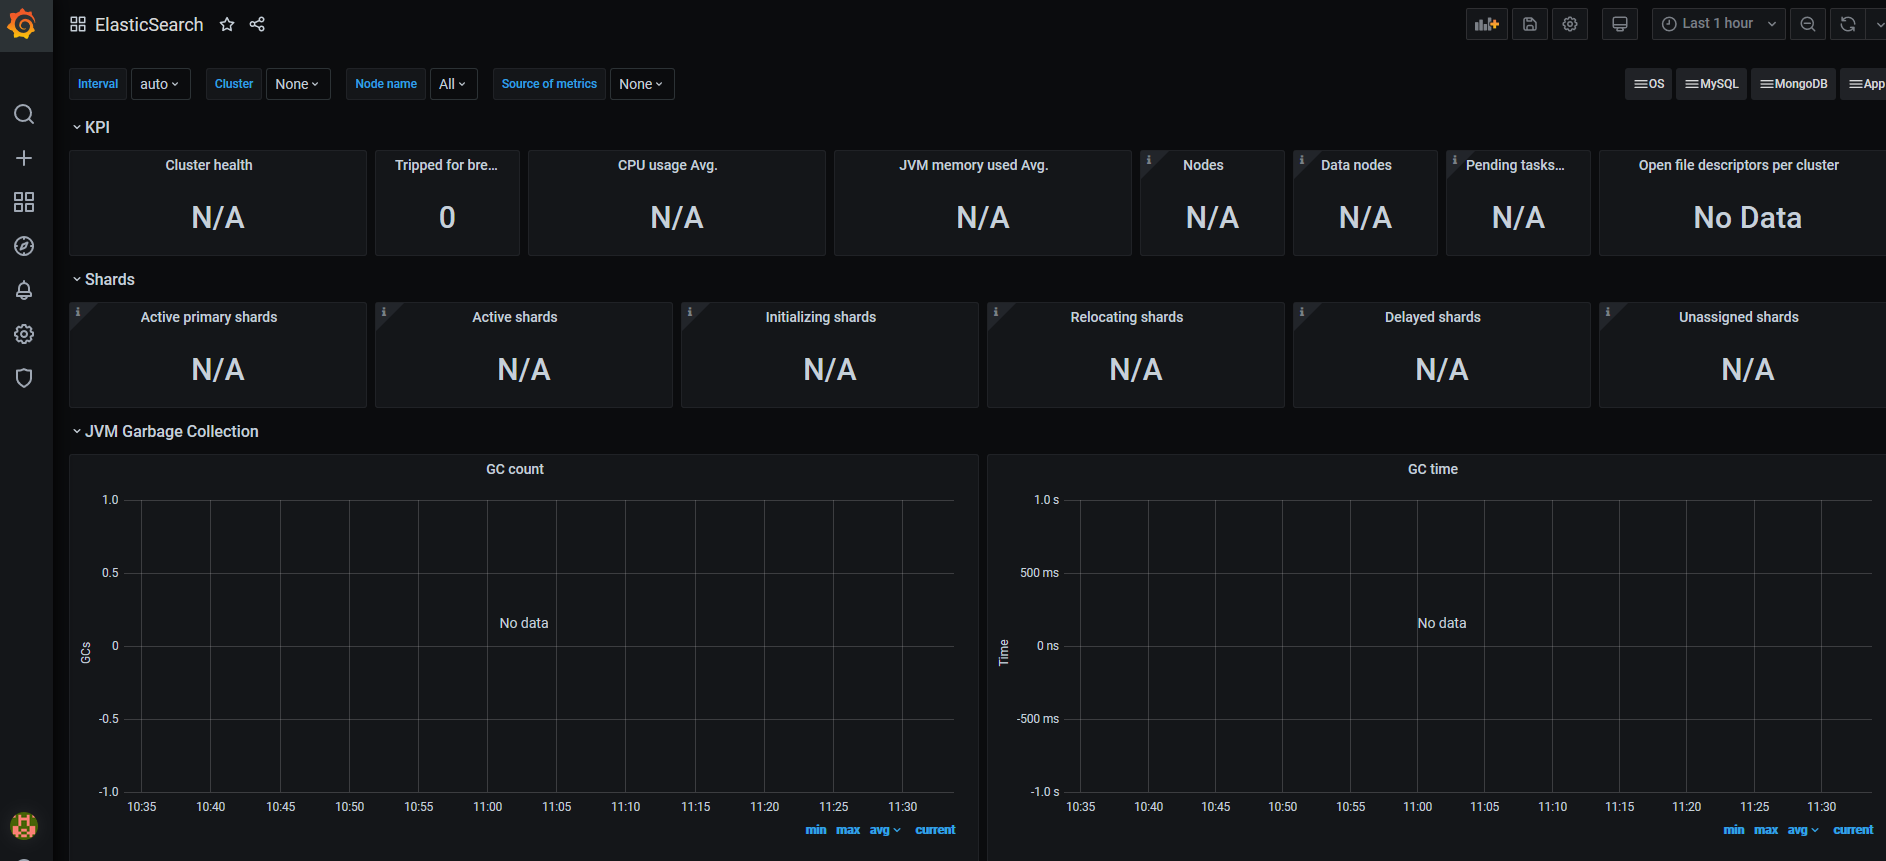
5,配置 Grafana 的模板
模板通过json文件进行导入,文件就在解压的包内。
参考地址:https://shenshengkun.github.io/posts/550bdf86.html
或者通过如下ID进行导入:2322以及其他。
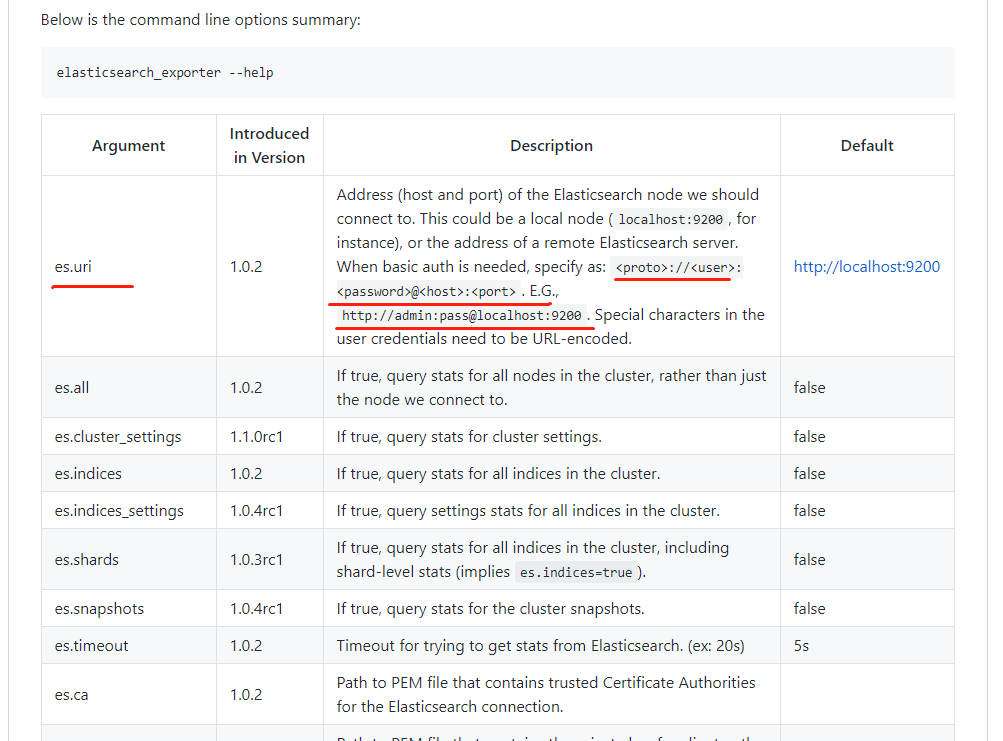
6,开启认证的启动方式
如果es开启了认证,那么启动的时候需要将用户名密码加载进去:
elasticsearch_exporter --web.listen-address ":9308" --es.uri http://username:password@192.168.75.21:9200 &
其中使用的是monitoring的用户密码。
当然,除去这种命令行的启动方式之外,还可以像上边一样,基于systemd进行管理,只需将认证的参数信息写入到如下内容当中:
参考网址:https://github.com/justwatchcom/elasticsearch_exporter
cat /etc/default/elasticsearch_exporter

[Unit]

Description=The es_exporter

After=network.target

[Service]

Type=simple

User=prometheus

ExecStart=/usr/local/elasticsearch_exporter/elasticsearch_exporter --web.listen-address ":9308" --es.uri=http://username:password@192.168.75.21:9200

Restart=on-failure

[Install]

WantedBy=multi-user.target
6.监控elasticsearch集群---放弃采用(获取不到数据),建议看另一篇文章:监控elasticsearch的更多相关文章
- shell脚本监控k8s集群job状态,若出现error通过触发阿里云的进程监控报警
#!/bin/bash while [ 1 ] do job_error_no=`kubectl get pod -n weifeng |grep -i "job"|grep -c ...
- Elasticsearch集群 管理
第7章 深入Elasticsearch集群 启动一个Elasticsearch节点时,该节点会开始寻找具有相同集群名字并且可见的主节点.如 果找到主节点,该节点加入一个已经组成了的集群:如果没有找到, ...
- 手把手教你搭建一个 Elasticsearch 集群
为何要搭建 Elasticsearch 集群 凡事都要讲究个为什么.在搭建集群之前,我们首先先问一句,为什么我们需要搭建集群?它有什么优势呢? 高可用性 Elasticsearch 作为一个搜索引擎, ...
- ElasticSearch 集群监控
要监控哪些 ElasticSearch metrics? Elasticsearch 提供了大量的 Metric,可以帮助您检测到问题的迹象,在遇到节点不可用.out-of-memory.long g ...
- zabbix监控Elasticsearch集群
本节以 zabbix 为例,介绍如何使用监控系统完成 Elasticsearch 的监控报警. github 上有好几个版本的 ESZabbix 仓库,都源自 Elastic 公司员工 unterge ...
- Prometheus监控elasticsearch集群(以elasticsearch-6.4.2版本为例)
部署elasticsearch集群,配置文件可"浓缩"为以下: cluster.name: es_cluster node.name: node1 path.data: /app/ ...
- Elasticsearch 集群优化-尽可能全面详细
Elasticsearch 集群优化-转载参考1 基本配置 基本配置,5台配置为 24C 125G 17T 的主机,每台主机上搭建了一个elasticsearch节点. 采用的elasticsearc ...
- Docker部署Elasticsearch集群
http://blog.sina.com.cn/s/blog_8ea8e9d50102wwik.html Docker部署Elasticsearch集群 参考文档: https://hub.docke ...
- Elasticsearch 集群 单服务器 超级详细教程
前言 之前了解了Elasticsearch的基本概念.将spring boot + ElasticSearch + head插件 搞通之后.紧接着对es进行下一步的探索:集群.查阅资料的过程中,找到了 ...
随机推荐
- 关于 Python 的 import
好久以前就被 Python 的相对与绝对导入所困扰.去年粗浅探究后自以为完全理解,近来又因 sys.path[0] 和 os.getcwd() 的不一致而刷新了认知... Python 官方文档 5. ...
- 4-6 Mabatis 框架
Mabatis 框架 Ⅰ.关于Mabatis 对数据库中的数据进行访问的框架 数据库执行过程: 连接数据库-->准备好SQL-->发送SQL语句-->执行语句-->获取结果-- ...
- Template -「平衡树」
Fhq-Treap. // Fhq-Treap const int MAXN = 1e5 + 5; struct Fhq_Treap { #define Lson Tr[p].l #define Rs ...
- 好串_via牛客网
题目 链接:https://ac.nowcoder.com/acm/contest/28537/C 来源:牛客网 时间限制:C/C++ 1秒,其他语言2秒 空间限制:C/C++ 32768K,其他语言 ...
- 第十八天python3 序列化和反序列化
思考: 内存中的字典.列表.集合以及各种对象,如何保存到一个文件中? 如果是自己定义的类的实例,如何保存到一个文件中? 如何从文件中读取数据,并让它们在内存中再次变成自己对应的类的实例? 要设计一套协 ...
- JS常用的3种弹出框
1.提示框 alert // 没有返回值 alert('你好'); 2.确认框 confirm // 返回 false/true let res = confirm('确定删除?'); if(res ...
- [Golang] cgo 调用 .so 捕获异常问题
最近需要在 go 中去调用 .so 库去完成一些事情,go 方面,利用 cgo 可以顺利的调用 .so 中的方法,但是有个问题是 go 没法捕获 .so 那边出现的异常.如果 .so 那边异常了,那么 ...
- 【java】学习路径17-用户注册登录实例(Scanner)
要学会使用接口.继承.多态.构造方法.包等知识编写出一个用户登录注册的事例.
- Docker问题:"docker build" requires exactly 1 argument.
今天在搭建Docker私有仓库的时候.提示错误:"docker build" requires exactly 1 argument. 原因是因为(少了一个 '.' , '.' 代 ...
- Linux之LVM逻辑卷管理
LVM逻辑卷管理 LVM机制:PV物理卷,VG卷组,LV逻辑卷. --功能-- --物理卷管理-- --卷组管理-- --逻辑卷管理-- create(建立) pvcreate vgcreate lv ...