Prometheus安装教程
Prometheus安装教程
欢迎关注
H寻梦人公众号

参考目录
- docker安装Prometheus
- 基于docker 搭建Prometheus+Grafana
- prometheus官方文档
- docker安装prometheus(普罗米修斯)
- Prometheus操作指南
相关链接
1、创建配置挂载目录
mkdir /data/prometheus

mkdir /data/prometheus/config

mkdir /data/prometheus/data

chmod 777 -R /data/prometheus
2、创建编辑配置文件
cd /data/prometheus/config

touch prometheus.yml

vim prometheus.yml
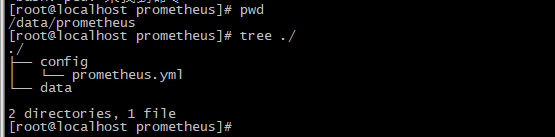
目录结构
# my global config

global:

  scrape_interval:     15s # Set the scrape interval to every 15 seconds. Default is every 1 minute.

  evaluation_interval: 15s # Evaluate rules every 15 seconds. The default is every 1 minute.

  # scrape_timeout is set to the global default (10s).

# Alertmanager configuration

alerting:

  alertmanagers:

  - static_configs:

    - targets:

      # - alertmanager:9093

# Load rules once and periodically evaluate them according to the global 'evaluation_interval'.

rule_files:

  # - "first_rules.yml"

  # - "second_rules.yml"

# A scrape configuration containing exactly one endpoint to scrape:

# Here it's Prometheus itself.

scrape_configs:

  # The job name is added as a label `job=<job_name>` to any timeseries scraped from this config.

  - job_name: 'prometheus'

    # metrics_path defaults to '/metrics'

    # scheme defaults to 'http'.

    static_configs:

    - targets: ['192.168.1.190:9091']

# 192.168.1.190 上的prometheus配置:

# my global config

global:

  scrape_interval:     15s # Set the scrape interval to every 15 seconds. Default is every 1 minute.

  evaluation_interval: 30s # Evaluate rules every 15 seconds. The default is every 1 minute.

  # scrape_timeout is set to the global default (10s).

# Alertmanager configuration

alerting:

  alertmanagers:

  - static_configs:

    - targets:

      # - alertmanager:9093

# Load rules once and periodically evaluate them according to the global 'evaluation_interval'.

rule_files:

  # - "first_rules.yml"

  # - "second_rules.yml"

# A scrape configuration containing exactly one endpoint to scrape:

# Here it's Prometheus itself.

scrape_configs:

  # The job name is added as a label `job=<job_name>` to any timeseries scraped from this config.

  - job_name: 'prometheus'

    # metrics_path defaults to '/metrics'

    # scheme defaults to 'http'.

    static_configs:

    - targets: ['192.168.1.190:9091']

  - job_name: 'node-exproter'

    static_configs:

      - targets: ['192.168.1.190:9100']

        labels:

          instance: 'localhost'

  - job_name: 'snmp-exproter'

    # metrics_path: '/metrics'

    static_configs:

      - targets: ['192.168.1.110:8999']

        labels:

          instance: 'snmp'

  - job_name: 'snmp-f5'

    # metrics_path: '/metrics'

    static_configs:

      - targets: ['192.168.1.110:8991']

        labels:

          instance: 'snmp-f5'

  - job_name: 'snmp-f5-mutli'

    # metrics_path: '/metrics'

    scrape_interval: 30s # 会覆盖全局配置

    scrape_timeout: 20s

    static_configs:

      - targets: ['192.168.1.106:8999']

        labels:

          instance: 'snmp-f5-multi'

  - job_name: 'pushgateway'

    metrics_path: '/metrics'

    scrape_interval: 30s # 会覆盖全局配置

    honor_labels: true  #加上此配置exporter节点上传数据中的一些标签将不会被pushgateway节点的相同标签覆盖

    static_configs:

      - targets: ['192.168.1.190:9092']

        labels:

          instance: 'pushgateway'
3、启动容器
docker run -p 9091:9090 -e TZ=Asia/Shanghai -v /data/prometheus/config/prometheus.yml:/etc/prometheus/prometheus.yml -v /data/prometheus/data:/data -d --name my_prometheus prom/prometheus
docker run  -d \

  -e TZ=Asia/Shanghai \

  -p 9091:9090 \

  -v /data/prometheus/prometheus.yml:/etc/prometheus/prometheus.yml  \

  prom/prometheus
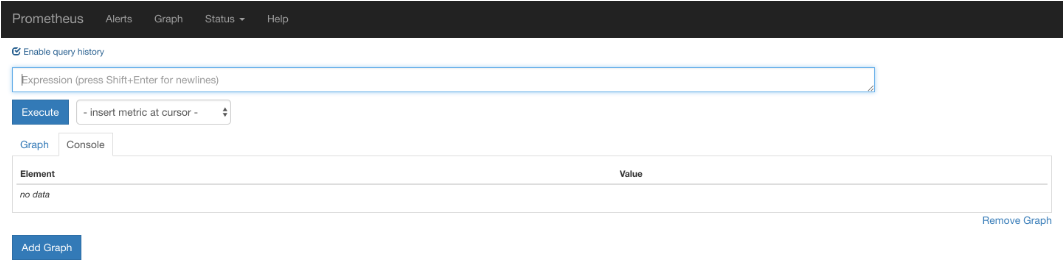
访问url:
http://192.168.91.132:9090/graph
效果如下:
访问targets,url如下:
http://192.168.1.190:9091/targets
效果如下:
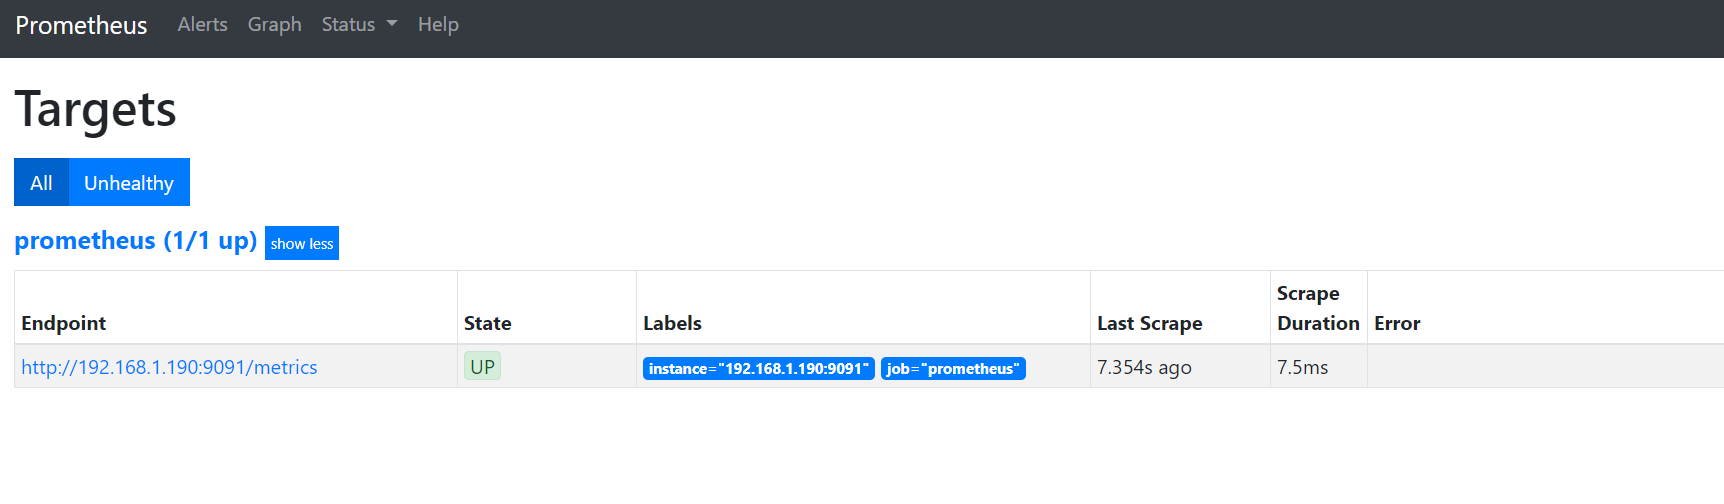
如果状态没有UP起来,等待一会,就会UP了
hint: 注意要开启指定的端口,以及定义任务的时候要配置指定target的ip
4、使用Node-Exproter作为监控对象
docker pull prom/node-exporter

docker run -d -p 9100:9100 \

  -e TZ=Asia/Shanghai \

  -v "/prometheus/node-exproter/proc:/host/proc:ro" \

  -v "/prometheus/node-exproter/sys:/host/sys:ro" \

  -v "/prometheus/node-exproter/rootfs:/rootfs:ro" \

  --net="host" \

  --name "my_node-exproter" \

  prom/node-exporter
5、使用grafana数据展示
# 拉去镜像

docker pull grafana/grafana

# 新建空文件夹grafana,用来存储数据

mkdir -p /data/grafana

# 设置权限

chmod 777 -R /data/grafana

# 因为grafana用户会在这个目录写入文件,直接设置777,比较简单粗暴!

# 启动grafana

docker run -d \

  -e TZ=Asia/Shanghai \

  -p 3000:3000 \

  --name=my_grafana \

  -v /data/grafana:/var/lib/grafana \

  grafana/grafana
6、Prometheus进阶
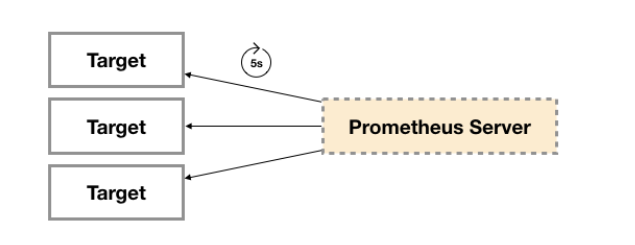
6.1 Expoter
广义上讲所有可以向Prometheus提供监控样本数据的程序都可以被称为一个Exporter。而Exporter的一个实例称为target,如下所示,Prometheus通过轮询的方式定期从这些target中获取样本数据:
从Exporter的来源上来讲,主要分为两类:
- 社区提供的
Prometheus社区提供了丰富的Exporter实现,涵盖了从基础设施,中间件以及网络等各个方面的监控功能。这些Exporter可以实现大部分通用的监控需求。下表列举一些社区中常用的Exporter:
| 范围 | 常用Exporter |
|---|---|
| 数据库 | MySQL Exporter, Redis Exporter, MongoDB Exporter, MSSQL Exporter等 |
| 硬件 | Apcupsd Exporter,IoT Edison Exporter, IPMI Exporter, Node Exporter等 |
| 消息队列 | Beanstalkd Exporter, Kafka Exporter, NSQ Exporter, RabbitMQ Exporter等 |
| 存储 | Ceph Exporter, Gluster Exporter, HDFS Exporter, ScaleIO Exporter等 |
| HTTP服务 | Apache Exporter, HAProxy Exporter, Nginx Exporter等 |
| API服务 | AWS ECS Exporter, Docker Cloud Exporter, Docker Hub Exporter, GitHub Exporter等 |
| 日志 | Fluentd Exporter, Grok Exporter等 |
| 监控系统 | Collectd Exporter, Graphite Exporter, InfluxDB Exporter, Nagios Exporter, SNMP Exporter等 |
| 其它 | Blockbox Exporter, JIRA Exporter, Jenkins Exporter, Confluence Exporter等 |
- 用户自定义的
除了直接使用社区提供的Exporter程序以外,用户还可以基于Prometheus提供的Client Library创建自己的Exporter程序,目前Promthues社区官方提供了对以下编程语言的支持:Go、Java/Scala、Python、Ruby。同时还有第三方实现的如:Bash、C++、Common Lisp、Erlang,、Haskeel、Lua、Node.js、PHP、Rust等。
Exporter规范
所有的Exporter程序都需要按照Prometheus的规范,返回监控的样本数据。以Node Exporter为例,当访问/metrics地址时会返回以下内容:
# HELP node_cpu Seconds the cpus spent in each mode.

# TYPE node_cpu counter

node_cpu{cpu="cpu0",mode="idle"} 362812.7890625

# HELP node_load1 1m load average.

# TYPE node_load1 gauge

node_load1 3.0703125
这是一种基于文本的格式规范,在Prometheus 2.0之前的版本还支持Protocol buffer规范。相比于Protocol buffer文本具有更好的可读性,以及跨平台性。Prometheus 2.0的版本也已经不再支持Protocol buffer,这里就不对Protocol buffer规范做详细的阐述。
6.2 Prometheus采集数据的推拉模式
Prometheus架构图:
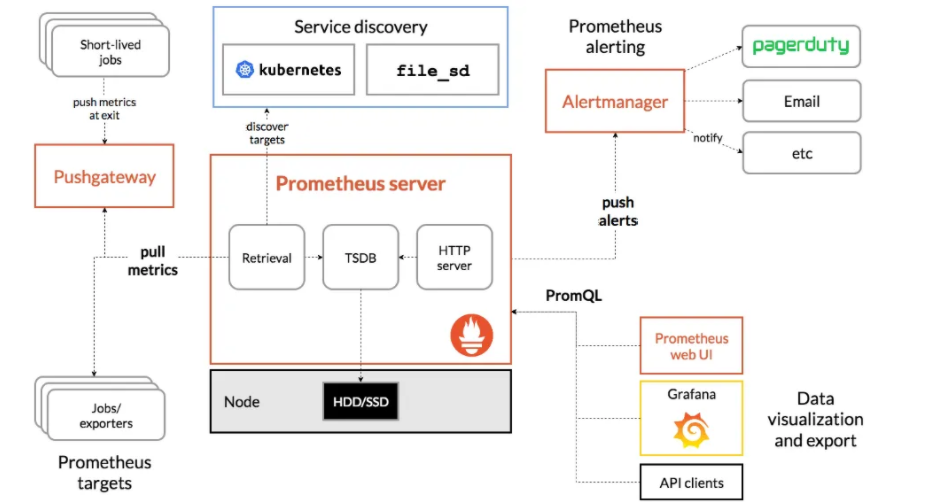
PULL:prometheus 用 pull 这种主动拉取的方式 (HTTP GET) 去访问每个节点上 exporter 并采样回需要的数据
PUSH:指的是 在客户端 ( 或者服务器 ) 安装 Pushgateway 插件,然后使用我们运维自行开发的各种脚本,把监控数据组织成 key/value 的形式,或者 metrics 形式发送给 Pushgateway,之后由 Pushgateway 再推送给 prometheus【这里其实使用的也是PULL的模式,不过现在prometheus不用再直接去拉各个Expoter,因为这些Expoter已经把数据都推到了Pushgateway上,prometheus只要去拉取Pushgateway上面的数据即可获取到所有Target的数据,从而间接的形成一种
PUSH模式】
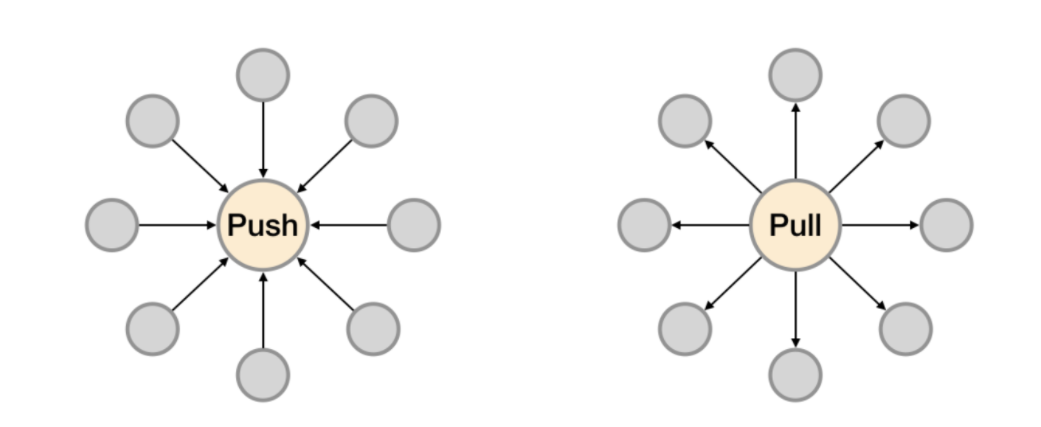
Prometheus推荐使用Pull模式,但是也支持Push模式。Pull还是Push,主要的区别在于数据搜集的主体执行者:
- Pull模式:由Prometheus Server根据配置,定期从提供监控数据地址去 “Pull” 相应的监控对象数据,比如从Node Exporter那里获取节点的监控信息。
- Push模式:从数据的流向的发起来看是从监控对象侧进行主动的数据提供,但是是通过pushgateway作为中间代理的角色,这种模式下增加了pushgateway的角色,首先由监控对象侧将数据发给pushgateway,然后Prometheus Server定期从pushgateway处获取相应的数据。
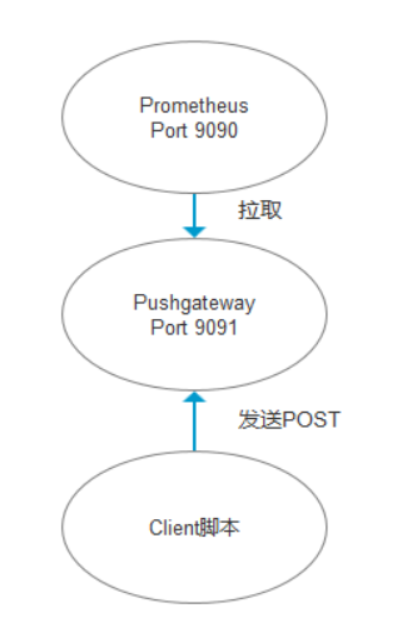
Pushgateway 是 Prometheus 生态中一个重要工具,使用它的原因主要是:
- Prometheus 采用 pull 模式,可能由于不在一个子网或者防火墙原因,导致 Prometheus 无法直接拉取各个 target 数据。
- 在监控业务数据的时候,需要将不同数据汇总, 由 Prometheus 统一收集。
由于以上原因,不得不使用 pushgateway,但在使用之前,有必要了解一下它的一些弊端:
- 将多个节点数据汇总到 pushgateway, 如果 pushgateway 挂了,受影响比多个 target 大。
- Prometheus 拉取状态
up只针对 pushgateway, 无法做到对每个节点有效。 - Pushgateway 可以持久化推送给它的所有监控数据。
因此,即使你的监控已经下线,prometheus 还会拉取到旧的监控数据,需要手动清理 pushgateway 不要的数据。
PUSH模式
6.3 Prometheus的服务发现方式
通常Prometheus 要增加一个target,需要在配置文件中已添加一个job,例如下:
- job_name: 'prometheus'

    static_configs:

      - targets: ['localhost:9090']
每次修改需要直接修改服务器上的配置文件,非常麻烦。
Prometheus也提供了服务发现功能,可以从consul,dns,kubernetes,file等等多种来源发现新的目标。
相关连接
6.4 AlertManager监控告警
当监控数据达到一个阈值,prometheus 会把报警信息推送到 Altermanager 软件上,Altermanager 再次推送到报警平台。
但是 Altermanager 的报警功能有很多不足,可以采用 Grafana 4.0 以后提供的报警功能来替代 Altermanager。
实现方案:
prometheus+grafana+alertmanger
Zabbix的使用
- https://www.cnblogs.com/zoulongbin/p/7792772.html
- https://www.jianshu.com/p/693d8bc81777
- https://blog.csdn.net/weixin_42743410/article/details/81482728
Prometheus安装教程的更多相关文章
- Linux+apache+mono+asp.net安装教程
Linux+apache+mono+asp.net安装教程(CentOS上测试的) 一.准备工作: 1.安装linux系统(CentOS,这个就不多讲了) 2.下载所需软件 http-2.4.4.ta ...
- Greenplum 源码安装教程 —— 以 CentOS 平台为例
Greenplum 源码安装教程 作者:Arthur_Qin 禾众 Greenplum 主体以及orca ( 新一代优化器 ) 的代码以可以从 Github 上下载.如果不打算查看代码,想下载编译好的 ...
- git 安装教程
昆,简单说下安装教程1,安装Git2,安装TortoiseGit3,打开第一步安装的git工具GIT BASH
- Docker和Docker-compose安装教程以及docker-elk,docker-storm安装教程
此安装教程仅供我自己安装配置时查看,其他的人不可以偷看!!! 安装Docker 1. Update package information, ensure that APT works with th ...
- RHEL 6.3 详细安装教程
以前刚接触linux时,什么都不懂,为了学习,在电脑上安装双系统(原系统为Win7),吃过不少苦头,在网上搜教程,很多都是语焉不详,导致安装过程中战战兢兢.最近朋友面试运维,面试官有考他对linux安 ...
- Android Studio的下载和安装教程(从ADT到AS)
之前一直使用的是Android development tools(简称ADT),后来说是google对ADT不再提供支持,然后一直在考虑是否把自己电脑换成Android Studio(简称AS),从 ...
- mysql快速导出数据库ER图和数据字典(附navicat11安装教程及资源)
♣ mysql使用navicat11快速导出数据库ER图 ♣ mysql使用navicat11快速导出数据库数据字典 ♣ navicat11 for mysql (这里是mysql5.7.12)专业版 ...
- Smokeping安装教程
Smokeping安装教程 #Smokeping2.6.8安装教程 #2016.3.6 改编v1.0 #Linux运维技术交流 347163978 环境 CentOS release 6.4 (F ...
- (二)ADS1.2的安装教程以及使用 调试 (不会 AXD 调试工具)
安装教程: 参考百度 http://jingyan.baidu.com/article/cdddd41c7db85253cb00e1ae.html 具体使用看: 杨铸的那本书(嵌入式底层软件驱动开发) ...
随机推荐
- mysql的半同步复制
1. binlog dump线程何时向从库发送binlog mysql在server层进行了组提交之后,为了提高并行度,将提交阶段分为了 flush sync commit三个阶段,根据sync_bi ...
- .NET MAUI RC 是完整的 API 并准备好起飞 (GA)
2022年4月12日 微软发布了 .NET Multiplatform App UI (.NET MAUI) 作为候选版本RC ,具体参见 https://devblogs.microsoft.com ...
- Service vs Factory vs provider的迷惑
刚开始我很迷惑的,但是经过一段时间的项目,还有看大漠老师的东西,似乎明白了,他们的区别也就是 一个人喜欢吃面还是吃饭或者肯德基区别.目的就是填饱肚子! 以下是它们在AngularJS源代码中的定义: ...
- 2021.07.09 K-D树
2021.07.09 K-D树 前置知识 1.二叉搜索树 2.总是很长的替罪羊树 K-D树 建树 K-D树具有二叉搜索树的形态,对于每一个分类标准,小于标准的节点在父节点左边,大于标准的节点在父节点右 ...
- 【Java分享客栈】从线上环境摘取了四个代码优化记录分享给大家
前言 因为前段时间新项目已经完成目前趋于稳定,所以最近我被分配到了公司的运维组,负责维护另外一个项目,包含处理客户反馈的日常问题,以及对系统缺陷进行优化. 经过了接近两周的维护,除了日常问题以外,代码 ...
- day02 真正的高并发还得看IO多路复用
教程说明 C++高性能网络服务保姆级教程 首发地址 day02 真正的高并发还得看IO多路复用 本节目的 使用epoll实现一个高并发的服务器 从单进程讲起 上节从一个基础的socket服务说起我们实 ...
- 继承 & super & 方法覆盖
简单继承 细节1: 细节2: 子类创建对象,先 父类构造器,后 子类的构造器,因为(默认的super) 细节3: 假设父类只有一个有参构造器, 此时需要子类用上super给定父类参数,才能通过编译 ...
- 【mq】从零开始实现 mq-04-启动检测与实现优化
前景回顾 [mq]从零开始实现 mq-01-生产者.消费者启动 [mq]从零开始实现 mq-02-如何实现生产者调用消费者? [mq]从零开始实现 mq-03-引入 broker 中间人 [mq]从零 ...
- form表单与CSS选择器和样式操作
form表单 """获取前端用户数据并发送给后端服务器""" <form action=""></fo ...
- Java课程课堂作业代码
前言 本文章只是单纯记录课堂老师布置的课堂作业代码,题目都比较简单,所以没有写解题思路,相信大家都能理解,当然其中有的解法和代码不是最优的,当时只是为了完成题目,后来也懒得改了,如果有不恰当或者不正确 ...