Python自学笔记——matplotlib极坐标.md
一、极坐标
在平面内取一个定点O,叫极点,引一条射线Ox,叫做极轴,再选定一个长度单位和角度的正方向(通常取逆时针方向)。对于平面内任何一点M,用ρ表示线段OM的长度(有时也用r表示),θ表示从Ox到OM的角度,ρ叫做点M的极径,θ叫做点M的极角,有序数对 (ρ,θ)就叫点M的极坐标,这样建立的坐标系叫做极坐标系。通常情况下,M的极径坐标单位为1(长度单位),极角坐标单位为rad(或°)

二、matplotlib绘制极坐标图
1.创建极坐标图
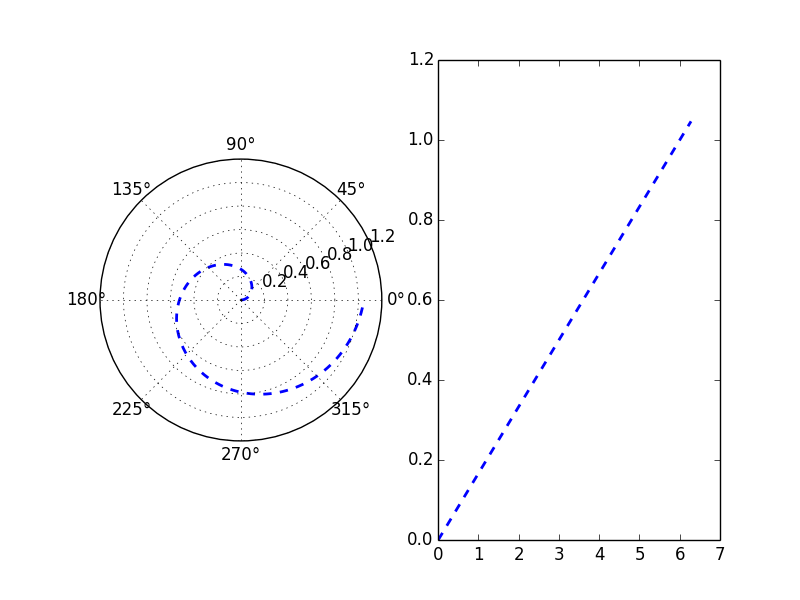
matplotlib的pyplot子库提供了绘制极坐标图的方法,在调用subplot()创建子图时通过设置projection='polar',便可创建一个极坐标子图,然后调用plot()在极坐标子图中绘图。
下面就创建一个极坐标子图和一个直角坐标子图进行对比。
import matplotlib.pyplot as plt

ax1 = plt.subplot(121, projection='polar')

ax2 = plt.subplot(122)

ax1.plot(theta,theta/6,'--',lw=2)

ax2.plot(theta,theta/6,'--',lw=2)

plt.show()
2.极坐标图设置
dir()命令可以得到一个对象的所有方法属性,通过比较ax1与ax2的方法属性便可知道极坐标有哪些设置方法。
>>> print(sorted(set(dir(ax1))-set(dir(ax2))))

['InvertedPolarTransform', 'PolarAffine', 'PolarTransform', 'RadialLocator', 'ThetaFormatter', '_default_rlabel_position', '_default_theta_direction', '_default_theta_offset', '_direction', '_r_label_position', '_theta_label1_position', '_theta_label2_position', '_theta_offset', '_xaxis_text1_transform', '_xaxis_text2_transform', '_yaxis_text_transform', 'get_rlabel_position', 'get_rmax', 'get_rmin', 'get_theta_direction', 'get_theta_offset', 'resolution', 'set_rgrids', 'set_rlabel_position', 'set_rlim', 'set_rmax', 'set_rmin', 'set_rscale', 'set_rticks', 'set_theta_direction', 'set_theta_offset', 'set_theta_zero_location', 'set_thetagrids', 'transProjection', 'transProjectionAffine', 'transPureProjection']
2.1 极坐标正方向
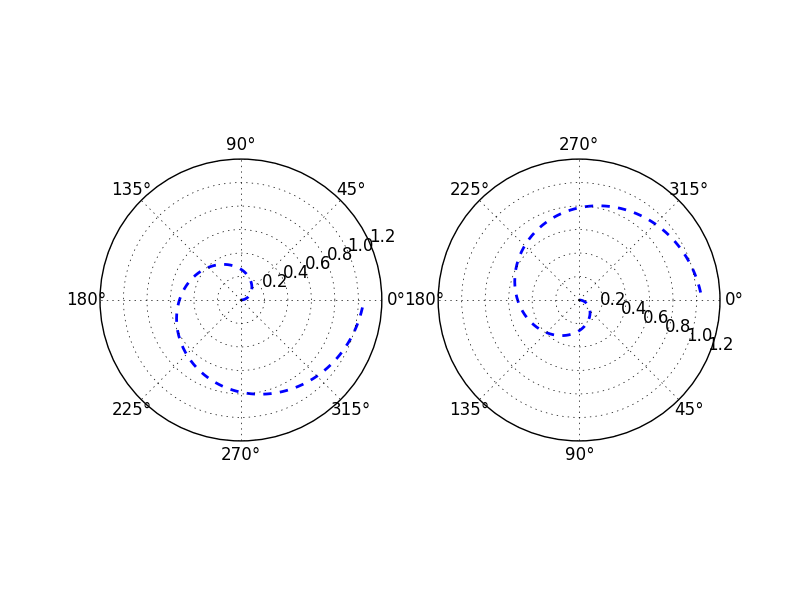
set_theta_direction方法用于设置极坐标的正方向
- 当
set_theta_direction的参数值为1,'counterclockwise'或者是'anticlockwise'的时候,正方向为逆时针; - 当
set_theta_direction的参数值为-1或者是'clockwise'的时候,正方向为顺时针; - 默认情况下正方向为逆时针
import matplotlib.pyplot as plt

import numpy as np

theta=np.arange(0,2*np.pi,0.02)

ax1= plt.subplot(121, projection='polar')

ax2= plt.subplot(122, projection='polar')

ax2.set_theta_direction(-1)

ax1.plot(theta,theta/6,'--',lw=2)

ax2.plot(theta,theta/6,'--',lw=2)

plt.show()
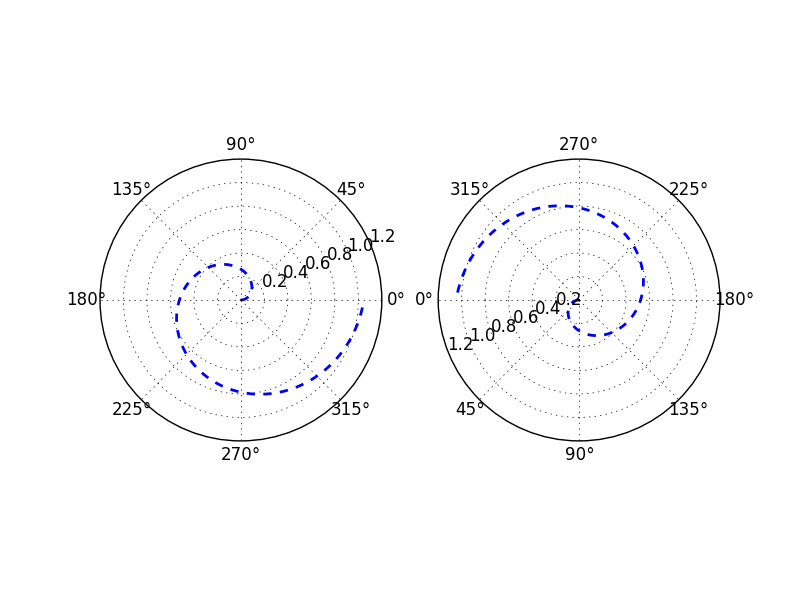
2.2 极坐标0°位置
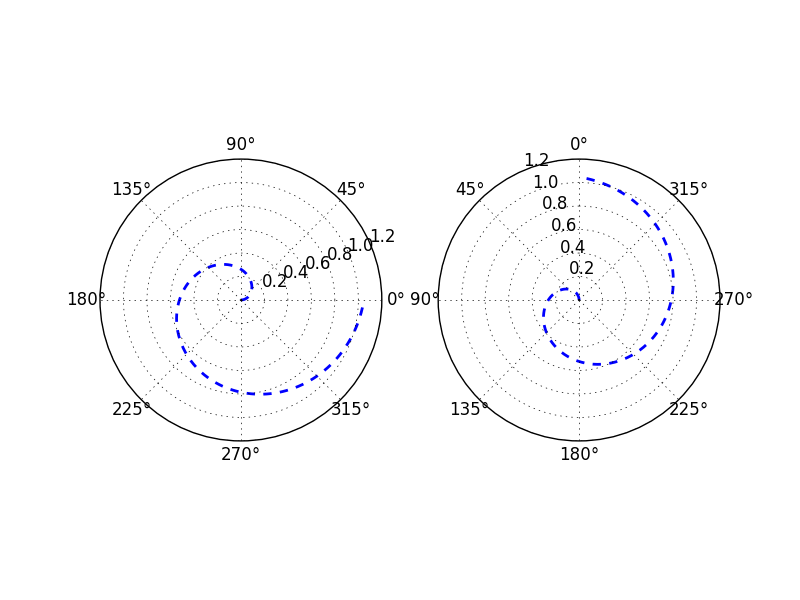
set_theta_zero_location方法用于设置极坐标0°位置
- 0°可设置在八个位置,分别为N, NW, W, SW, S, SE, E, NE
- 当
set_theta_zero_location的参数值为'N','NW','W','SW','S','SE','E','NE'时,0°分别对应的位置为方位N, NW, W, SW, S, SE, E, NE; - 默认情况下0°位于E方位
import matplotlib.pyplot as plt

import numpy as np

theta=np.arange(0,2*np.pi,0.02)

ax1= plt.subplot(121, projection='polar')

ax2= plt.subplot(122, projection='polar')

ax2.set_theta_zero_location('N')

ax1.plot(theta,theta/6,'--',lw=2)

ax2.plot(theta,theta/6,'--',lw=2)

plt.show()
2.3极坐标角度网格线显示
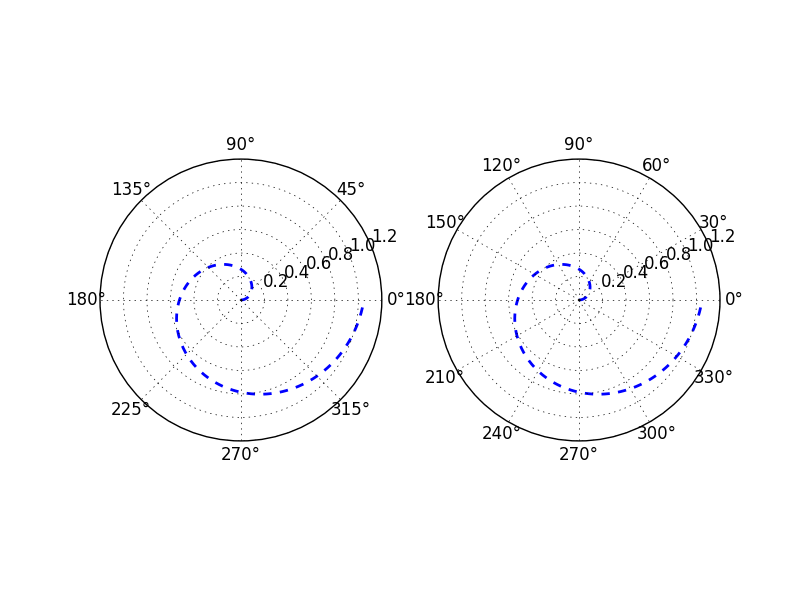
set_thetagrids方法用于设置极坐标角度网格线显示
- 参数为所要显示网格线的角度值列表
- 默认显示0°、45°、90°、135°、180°、225°、270°、315°的网格线
import matplotlib.pyplot as plt

import numpy as np

theta=np.arange(0,2*np.pi,0.02)

ax1= plt.subplot(121, projection='polar')

ax2= plt.subplot(122, projection='polar')

ax2.set_thetagrids(np.arange(0.0, 360.0, 30.0))

ax1.plot(theta,theta/6,'--',lw=2)

ax2.plot(theta,theta/6,'--',lw=2)

plt.show()
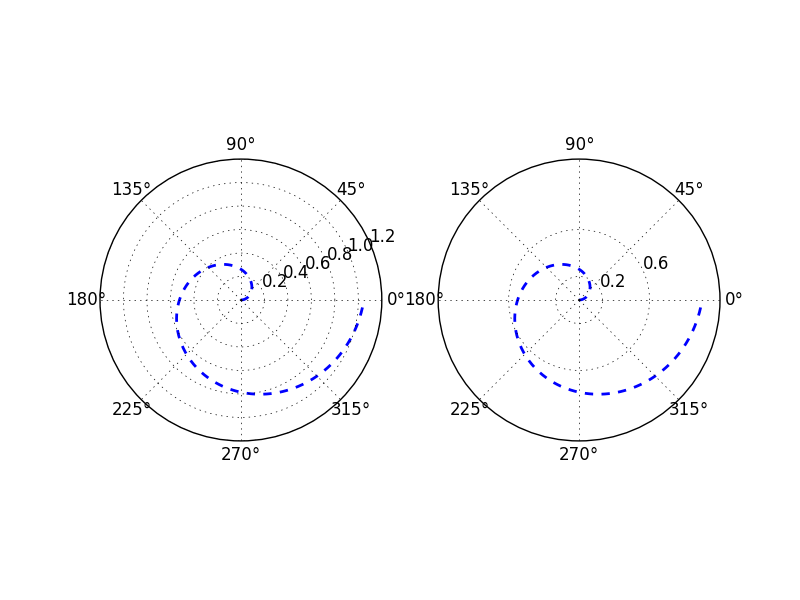
2.4极坐标角度偏离
set_theta_offset方法用于设置角度偏离
- 参数值为弧度值数值
import matplotlib.pyplot as plt

import numpy as np

theta=np.arange(0,2*np.pi,0.02)

ax1= plt.subplot(121, projection='polar')

ax2= plt.subplot(122, projection='polar')

ax2.set_theta_offset(np.pi)

ax1.plot(theta,theta/6,'--',lw=2)

ax2.plot(theta,theta/6,'--',lw=2)

plt.show()
2.5极坐标极径网格线显示
set_rgrids方法用于设置极径网格线显示
- 参数值为所要显示网格线的极径值列表,最小值不能小于等于0
import matplotlib.pyplot as plt

import numpy as np

theta=np.arange(0,2*np.pi,0.02)

ax1= plt.subplot(121, projection='polar')

ax2= plt.subplot(122, projection='polar')

ax2.set_rgrids(np.arange(0.2,1.0,0.4))

ax1.plot(theta,theta/6,'--',lw=2)

ax2.plot(theta,theta/6,'--',lw=2)

plt.show()
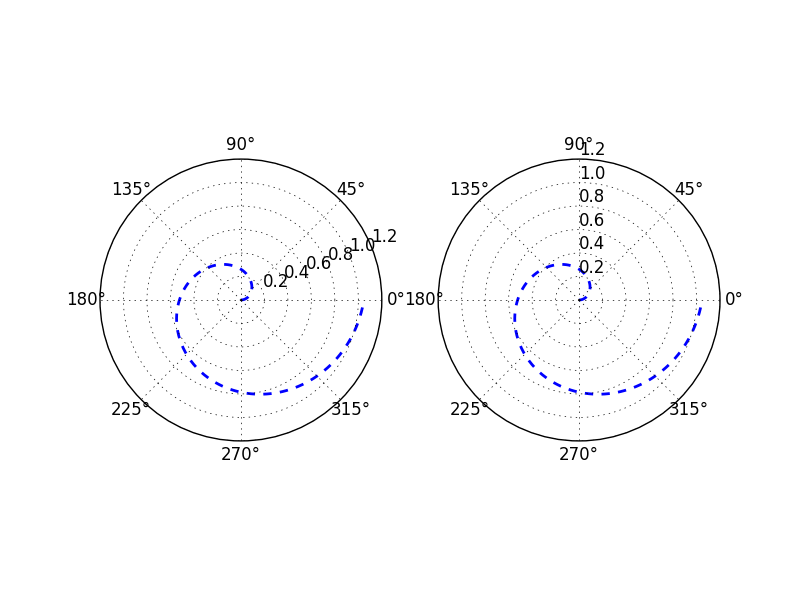
2.6极坐标极径标签位置
set_rlabel_position方法用于设置极径标签显示位置
- 参数为标签所要显示在的角度
import matplotlib.pyplot as plt

import numpy as np

theta=np.arange(0,2*np.pi,0.02)

ax1= plt.subplot(121, projection='polar')

ax2= plt.subplot(122, projection='polar')

ax2.set_rlabel_position('90')

ax1.plot(theta,theta/6,'--',lw=2)

ax2.plot(theta,theta/6,'--',lw=2)

plt.show()
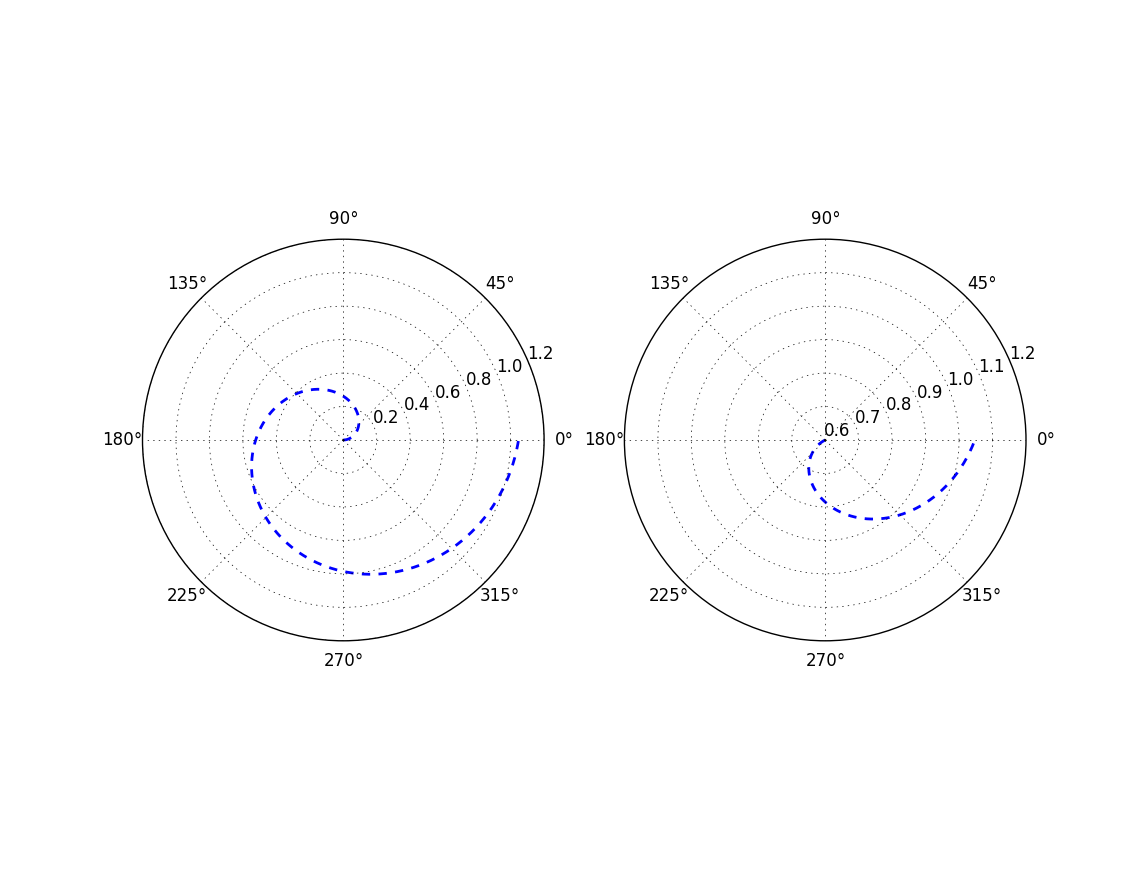
2.7极坐标极径范围
set_rlim方法用于设置显示的极径范围
- 参数为极径最小值,最大值
import matplotlib.pyplot as plt

import numpy as np

theta=np.arange(0,2*np.pi,0.02)

ax1= plt.subplot(121, projection='polar')

ax2= plt.subplot(122, projection='polar')

ax2.set_rlim(0.6,1.2)

ax1.plot(theta,theta/6,'--',lw=2)

ax2.plot(theta,theta/6,'--',lw=2)

plt.show()
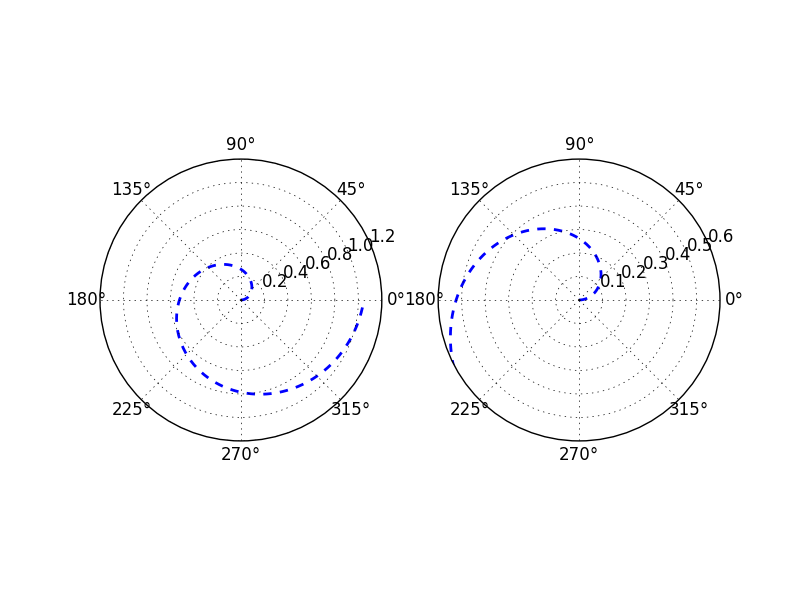
2.8极坐标极径最大值
set_rmax方法用于设置显示的极径最大值
- 该方法要在绘制完图像后使用才有效
import matplotlib.pyplot as plt

import numpy as np

theta=np.arange(0,2*np.pi,0.02)

ax1= plt.subplot(121, projection='polar')

ax2= plt.subplot(122, projection='polar')

ax1.plot(theta,theta/6,'--',lw=2)

ax2.plot(theta,theta/6,'--',lw=2)

ax2.set_rmax(0.6)

plt.show()
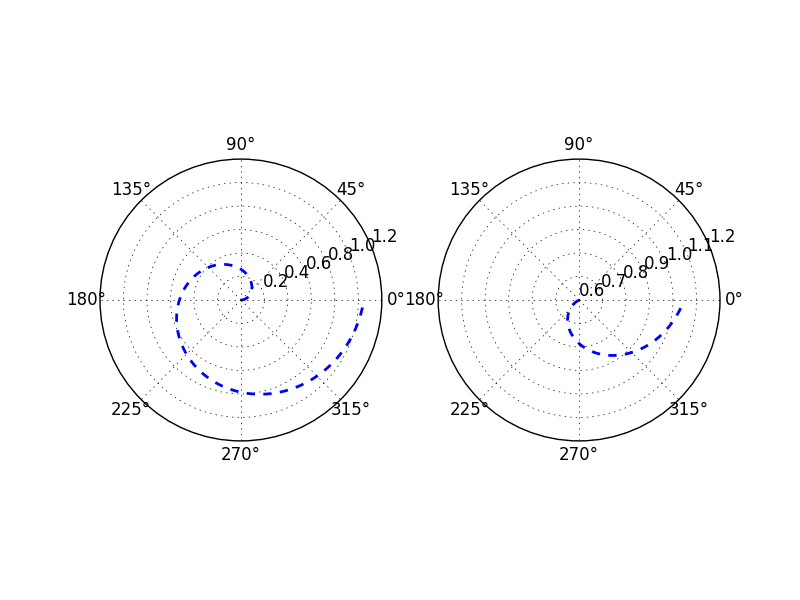
2.9极坐标极径最小值
set_rmin方法用于设置显示的极径最小值
- 该方法要在绘制完图像后使用才有效
import matplotlib.pyplot as plt

import numpy as np

theta=np.arange(0,2*np.pi,0.02)

ax1= plt.subplot(121, projection='polar')

ax2= plt.subplot(122, projection='polar')

ax1.plot(theta,theta/6,'--',lw=2)

ax2.plot(theta,theta/6,'--',lw=2)

ax2.set_rmin(0.6)

plt.show()
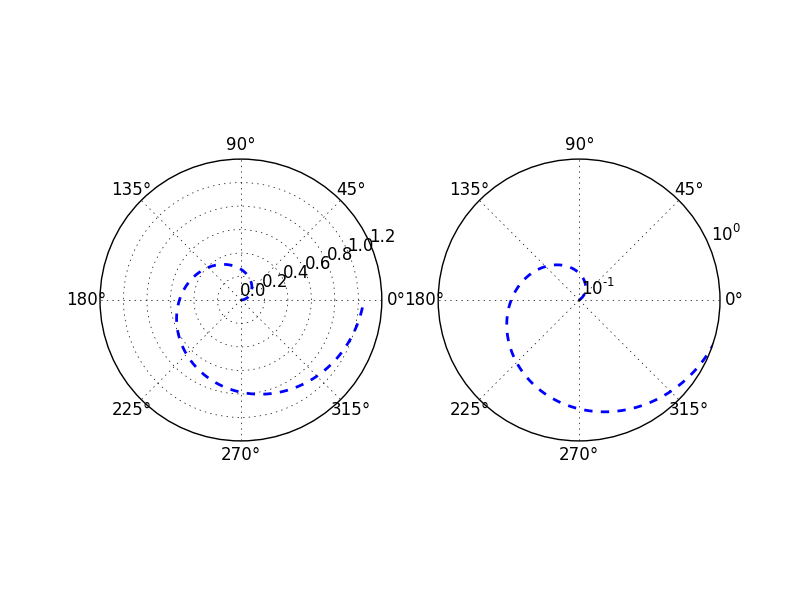
2.10 极径对数坐标
set_rscale方法用于设置极径对数坐标
- 参数值为'linear','log','symlog'
- 默认值为'linear'
- 该方法要在绘制完图像后使用才有效
import matplotlib.pyplot as plt

import numpy as np

theta=np.arange(0,2*np.pi,0.02)

ax1= plt.subplot(121, projection='polar')

ax2= plt.subplot(122, projection='polar')

ax1.plot(theta,theta/6,'--',lw=2)

ax2.plot(theta,theta/6,'--',lw=2)

ax2.set_rlim(math.pow(10,-1),math.pow(10,0))

ax1.set_rscale('linear')

ax2.set_rscale('symlog')

plt.show()
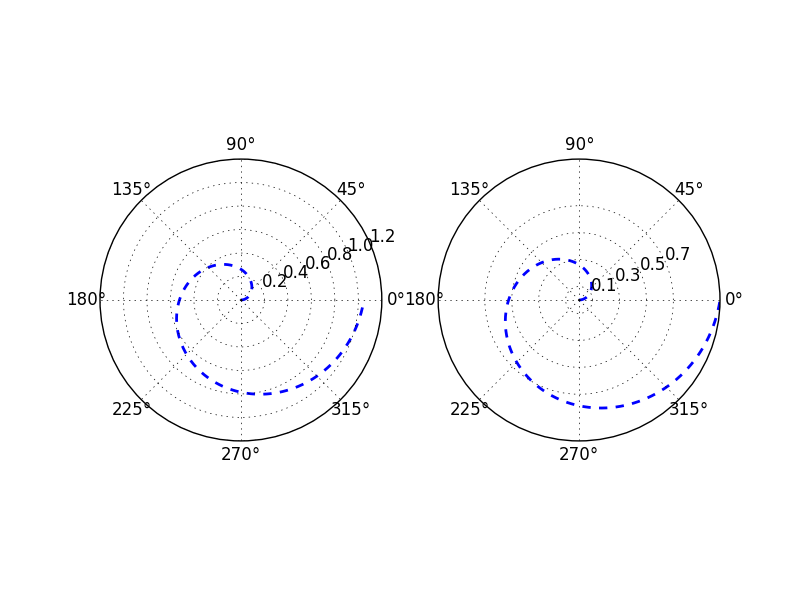
2.11 极坐标极径网格线显示范围
set_rticks方法用于设置极径网格线的显示范围
import matplotlib.pyplot as plt

import numpy as np

theta=np.arange(0,2*np.pi,0.02)

ax1= plt.subplot(121, projection='polar')

ax2= plt.subplot(122, projection='polar')

ax2.set_rticks(np.arange(0.1, 0.9, 0.2))

ax1.plot(theta,theta/6,'--',lw=2)

ax2.plot(theta,theta/6,'--',lw=2)

plt.show()
想观看Matplotlib教学视频,了解更多Matplotlib实用技巧可关注
微信公众账号: MatplotlibClass

今日头条号:Matplotlib小讲堂

Python自学笔记——matplotlib极坐标.md的更多相关文章
- Python自学笔记——Matplotlib风羽自定义
[前言]对于气象专业的小学生来说,风场是预报重要的参考数据,我们所知的风羽有四种:短线代表风速2m/s,长线代表风速4m/s,空心三角代表风速20m/s,实心三角代表风速50m/s.而matplotl ...
- python自学笔记
python自学笔记 python自学笔记 1.输出 2.输入 3.零碎 4.数据结构 4.1 list 类比于java中的数组 4.2 tuple 元祖 5.条件判断和循环 5.1 条件判断 5.2 ...
- python自学笔记(一)
我没学过python,通过网上和一些图书资料,自学并且记下笔记. 很多细节留作以后自己做项目时再研究,这样能更高效一些. python基础自学笔记 一.基本输入和输出 pthon3.0用input提示 ...
- python自学笔记一
之前看过一段时间的小甲鱼零基础自学python,b站上有高清免费资源[av4050443],但是作为零基础实在学得艰难,下载了python核心编程pdf,在这里做一些笔记. 虽然使用的是第二版的教材, ...
- Python 自学笔记(一)环境搭建
一,关于Python的介绍 关于Python的介绍,我不想多说了,网上随便一搜,很多介绍,这里我主要写下我的自学Python的 过程,也是为了促进我能继续学习下去. 二,环境搭建 1,这里我只讲解Wi ...
- python 自学笔记(四) 列表
有几天没有更新博客了,毕竟是自学,最近事情确实比较多,有时候想学的时候反而没时间,到有时间的时候反而不想学.以后得想办法改掉这个缺点,只要有时间就要学习自己想学的东西,希望自学的同学能和我共同交流,其 ...
- 如何深入系统的学习一门编程语言——python自学笔记
前言 最早接触python的时候,他并没有现在这么火,我也没把他太当回事,那时候我对python的印象就是给运维人员使用的一门很古老的语言,显然随着tensorflow(以下简称tf)的兴起,pyth ...
- python自学笔记二
:#进入循环重输文0件名 pass else:#退出循环,等待创建 break fobj = open(fname,'a')#打开或创建文件 #接下来写入文件 all = [] print('ente ...
- Python 自学笔记(二)第一个程序 Hello World
一 打印 Hello world 1,输入 Python “Hello world” 即可 2,脚本文件输出Hello World 在命令行(cmd),输入 python 文件路径+文件名 3,为什么 ...
随机推荐
- (原创)我对未来的人类的发展,以及AI技术发展的一些思考。
最近AI非常的火,不仅仅是阿尔法狗的成功,因为它击败了人类最强的大脑,颠覆了人类几千年来的对传统的认识,也让人类意识 到了一个问题:天外有天,人外有AI. 那么AI究竟会对人类的未来造成什么深远的影响 ...
- Rotate Array leetcode
Rotate an array of n elements to the right by k steps. For example, with n = 7 and k = 3, the array ...
- 4052: [Cerc2013]Magical GCD
4052: [Cerc2013]Magical GCD Time Limit: 10 Sec Memory Limit: 128 MBSubmit: 148 Solved: 70[Submit][ ...
- VueJs学习路线
对于这个东西,我本人也是初学者,收集一些学习资源的链接,用于个人资源的学习,也分享给大家 lavyun的博客 里面有一些给初学者的建议,学习路线 http://www.cnblogs.com/smar ...
- Redis Sentinel中的机制与原理详解
序言 Redis-Sentinel是Redis官方推荐的高可用性(HA)解决方案.实际上这意味着你可以使用Sentinel模式创建一个可以不用人为干预而应对各种故障的Redis部署. 它的主要功能有以 ...
- iOS网络编程笔记——编写自己的网络客户端
编写网络客户端主要有四个步骤: (1)项目中引入Accounts和Social框架 Accounts框架中有进行用户账户认证所需类,Social框架提供了我们所需要的SLRequest类. (2)用户 ...
- El表达式的用法个人总结
EL表达式的好处: 通过EL可以简化在JSP开发中对对象的引用,从而规范页面代码,增加程序的可读性及可维护性. EL表达式的几个特点: 1:可以与jsp标签库结合使用,也可以与javascript语 ...
- iPhone safari中Document事件不触发的解决方案 [冒泡]
写了一个下拉菜单,在单击空白地方的时候隐藏. 第一时间就是用$(document).click(function(){ //隐藏代码 }); 各大浏览器都没问题,唯独iPhone上的不会触发事件 ...
- mongoose简单使用样例
新建文件 app.js 内容如下: var mongoose = require('mongoose') , Schema = mongoose.Schema; mongoose.connect('m ...
- 从编译安装Keepalived 到 配置 负载均衡(LVS-DR)
最近在研究服务器高可用集群 (HA)…… Keepalived 是用C写的软路由.提供负载均衡与高可用特性. 负载均衡利用IPVS技术 高可用通过VRRP协议实现 更难能的贵的是,一直到最近还在更新 ...