Iperf[转]
原文链接:https://openmaniak.com/iperf.php
Iperf is a tool to measure the bandwidth and the quality of a network link. Jperf can be associated with Iperf to provide a graphical frontend written in Java.
The network link is delimited by two hosts running Iperf.
The quality of a link can be tested as follows:
- Latency (response time or RTT): can be measured with the Ping command.
- Jitter (latency variation): can be measured with an Iperf UDP test.
- Datagram loss: can be measured with an Iperf UDP test.
The bandwidth is measured through TCP tests.
To be clear, the difference between TCP (Transmission Control Protocol) and UDP (User Datagram Protocol) is that TCP use processes to check that the packets are correctly sent to the receiver whereas with UDP the packets are sent without any checks but with the advantage of being quicker than TCP.
Iperf uses the different capacities of TCP and UDP to provide statistics about network links.
Finally, Iperf can be installed very easily on any UNIX/Linux or Microsoft Windows system. One host must be set as client, the other one as server.
Here is a diagram where Iperf is installed on a Linux and Microsoft Windows machine.
Linux is used as the Iperf client and Windows as the Iperf server. Of course, it is also possible to use two Linux boxes.
 |
Iperf tests:
| no arg. -b -r -d -w |
Default settings Data format Bi-directional bandwidth Simultaneous bi-directional bandwidth TCP Window size |
-p, -t, -i -u, -b -m -M -P -h |
Port, timing and interval UDP tests, bandwidth settings Maximum Segment Size display Maximum Segment Size settings Parallel tests help |
| no arg. -d -u, -b |
Default settings Simultaneous bi-directional bandwidth UDP tests, bandwidth settings |
 Default Iperf settings:
Also check "Jperf section.
By default, the Iperf client connects to the Iperf server on the TCP port 5001 and the bandwidth displayed by Iperf is the bandwidth from the client to the server.
If you want to use UDP tests, use the -u argument.
The -d and -r Iperf client arguments measure the bi-directional bandwidths. (See further on this tutorial) Client side:
| #iperf -c 10.1.1.1 |
------------------------------------------------------------
Client connecting to 10.1.1.1, TCP port 5001
TCP window size: 16384 Byte (default)
------------------------------------------------------------
[ 3] local 10.6.2.5 port 33453 connected with 10.1.1.1 port 5001
[ 3] 0.0-10.2 sec 1.26 MBytes 1.05 Mbits/sec Server side:
| #iperf -s |
------------------------------------------------------------
Server listening on TCP port 5001
TCP window size: 8.00 KByte (default)
------------------------------------------------------------
[852] local 10.1.1.1 port 5001 connected with 10.6.2.5 port 33453
[ ID] Interval Transfer Bandwidth
[852] 0.0-10.6 sec 1.26 MBytes 1.03 Mbits/sec
Data formatting: (-f argument)
The -f argument can display the results in the desired format: bits(b), bytes(B), kilobits(k), kilobytes(K), megabits(m), megabytes(M), gigabits(g) or gigabytes(G).
Generally the bandwidth measures are displayed in bits (or Kilobits, etc ...) and an amount of data is displayed in bytes (or Kilobytes, etc ...).
As a reminder, 1 byte is equal to 8 bits and, in the computer science world, 1 kilo is equal to 1024 (2^10).
For example: 100'000'000 bytes is not equal to 100 Mbytes but to 100'000'000/1024/1024 = 95.37 Mbytes. Client side:
| #iperf -c 10.1.1.1 -f b |
------------------------------------------------------------
Client connecting to 10.1.1.1, TCP port 5001
TCP window size: 16384 Byte (default)
------------------------------------------------------------
[ 3] local 10.6.2.5 port 54953 connected with 10.1.1.1 port 5001
[ 3] 0.0-10.2 sec 1359872 Bytes 1064272 bits/sec Server side:
| #iperf -s |
------------------------------------------------------------
Server listening on TCP port 5001
TCP window size: 8.00 KByte (default)
------------------------------------------------------------
[852] local 10.1.1.1 port 5001 connected with 10.6.2.5 port 33453
[ ID] Interval Transfer Bandwidth
[852] 0.0-10.6 sec 920 KBytes 711 Kbits/sec  Top of the page
Bi-directional bandwidth measurement: (-r argument)
The Iperf server connects back to the client allowing the bi-directional bandwidth measurement. By default, only the bandwidth from the client to the server is measured.
If you want to measure the bi-directional bandwidth simultaneously, use the -d keyword. (See next test.) Client side:
| #iperf -c 10.1.1.1 -r |
------------------------------------------------------------
Server listening on TCP port 5001
TCP window size: 85.3 KByte (default)
------------------------------------------------------------
------------------------------------------------------------
Client connecting to 10.1.1.1, TCP port 5001
TCP window size: 16.0 KByte (default)
------------------------------------------------------------
[ 5] local 10.6.2.5 port 35726 connected with 10.1.1.1 port 5001
[ 5] 0.0-10.0 sec 1.12 MBytes 936 Kbits/sec
[ 4] local 10.6.2.5 port 5001 connected with 10.1.1.1 port 1640
[ 4] 0.0-10.1 sec 74.2 MBytes 61.7 Mbits/sec Server side:
| #iperf -s |
------------------------------------------------------------
Server listening on TCP port 5001
TCP window size: 8.00 KByte (default)
------------------------------------------------------------
[852] local 10.1.1.1 port 5001 connected with 10.6.2.5 port 54355
[ ID] Interval Transfer Bandwidth
[852] 0.0-10.1 sec 1.15 MBytes 956 Kbits/sec
------------------------------------------------------------
Client connecting to 10.6.2.5, TCP port 5001
TCP window size: 8.00 KByte (default)
------------------------------------------------------------
[824] local 10.1.1.1 port 1646 connected with 10.6.2.5 port 5001
[ ID] Interval Transfer Bandwidth
[824] 0.0-10.0 sec 73.3 MBytes 61.4 Mbits/sec Top of the page
Simultaneous bi-directional bandwidth measurement: (-d argument)
Also check the "Jperf" section.
To measure the bi-directional bandwidths simultaneousely, use the -d argument. If you want to test the bandwidths sequentially, use the -r argument (see previous test).
By default (ie: without the -r or -d arguments), only the bandwidth from the client to the server is measured. Client side:
| #iperf -c 10.1.1.1 -d |
------------------------------------------------------------
Server listening on TCP port 5001
TCP window size: 85.3 KByte (default)
------------------------------------------------------------
------------------------------------------------------------
Client connecting to 10.1.1.1, TCP port 5001
TCP window size: 16.0 KByte (default)
------------------------------------------------------------
[ 5] local 10.6.2.5 port 60270 connected with 10.1.1.1 port 5001
[ 4] local 10.6.2.5 port 5001 connected with 10.1.1.1 port 2643
[ 4] 0.0-10.0 sec 76.3 MBytes 63.9 Mbits/sec
[ 5] 0.0-10.1 sec 1.55 MBytes 1.29 Mbits/sec Server side:
| #iperf -s |
------------------------------------------------------------
Server listening on TCP port 5001
TCP window size: 8.00 KByte (default)
------------------------------------------------------------
[852] local 10.1.1.1 port 5001 connected with 10.6.2.5 port 60270
------------------------------------------------------------
Client connecting to 10.6.2.5, TCP port 5001
TCP window size: 8.00 KByte (default)
------------------------------------------------------------
[800] local 10.1.1.1 port 2643 connected with 10.6.2.5 port 5001
[ ID] Interval Transfer Bandwidth
[800] 0.0-10.0 sec 76.3 MBytes 63.9 Mbits/sec
[852] 0.0-10.1 sec 1.55 MBytes 1.29 Mbits/sec Top of the page
TCP Window size: (-w argument)
The TCP window size is the amount of data that can be buffered during a connection without a validation from the receiver.
It can be between 2 and 65,535 bytes.
On Linux systems, when specifying a TCP buffer size with the -w argument, the kernel allocates double as much as indicated. Client side:
| #iperf -c 10.1.1.1 -w 2000 |
WARNING: TCP window size set to 2000 bytes. A small window size
will give poor performance. See the Iperf documentation.
------------------------------------------------------------
Client connecting to 10.1.1.1, TCP port 5001
TCP window size: 3.91 KByte (WARNING: requested 1.95 KByte)
------------------------------------------------------------
[ 3] local 10.6.2.5 port 51400 connected with 10.1.1.1 port 5001
[ 3] 0.0-10.1 sec 704 KBytes 572 Kbits/sec Server side:
| #iperf -s -w 4000 |
------------------------------------------------------------
Server listening on TCP port 5001
TCP window size: 3.91 KByte
------------------------------------------------------------
[852] local 10.1.1.1 port 5001 connected with 10.6.2.5 port 51400
[ ID] Interval Transfer Bandwidth
[852] 0.0-10.1 sec 704 KBytes 570 Kbits/sec Top of the page
Communication port (-p), timing (-t) and interval (-i):
The Iperf server communication port can be changed with the -p argument. It must be configured on the client and the server with the same value, default is TCP port 5001.
The -t argument specifies the test duration time in seconds, default is 10 secs.
The -i argument indicates the interval in seconds between periodic bandwidth reports. Client side:
| #iperf -c 10.1.1.1 -p 12000 -t 20 -i 2 |
------------------------------------------------------------
Client connecting to 10.1.1.1, TCP port 12000
TCP window size: 16.0 KByte (default)
------------------------------------------------------------
[ 3] local 10.6.2.5 port 58316 connected with 10.1.1.1 port 12000
[ 3] 0.0- 2.0 sec 224 KBytes 918 Kbits/sec
[ 3] 2.0- 4.0 sec 368 KBytes 1.51 Mbits/sec
[ 3] 4.0- 6.0 sec 704 KBytes 2.88 Mbits/sec
[ 3] 6.0- 8.0 sec 280 KBytes 1.15 Mbits/sec
[ 3] 8.0-10.0 sec 208 KBytes 852 Kbits/sec
[ 3] 10.0-12.0 sec 344 KBytes 1.41 Mbits/sec
[ 3] 12.0-14.0 sec 208 KBytes 852 Kbits/sec
[ 3] 14.0-16.0 sec 232 KBytes 950 Kbits/sec
[ 3] 16.0-18.0 sec 232 KBytes 950 Kbits/sec
[ 3] 18.0-20.0 sec 264 KBytes 1.08 Mbits/sec
[ 3] 0.0-20.1 sec 3.00 MBytes 1.25 Mbits/sec Server side:
| #iperf -s -p 12000 |
------------------------------------------------------------
Server listening on TCP port 12000
TCP window size: 8.00 KByte (default)
------------------------------------------------------------
[852] local 10.1.1.1 port 12000 connected with 10.6.2.5 port 58316
[ ID] Interval Transfer Bandwidth
[852] 0.0-20.1 sec 3.00 MBytes 1.25 Mbits/sec Top of the page
UDP tests: (-u), bandwidth settings (-b)
Also check the "Jperf" section.
The UDP tests with the -u argument will give invaluable information about the jitter and the packet loss. If you don't specify the -u argument, Iperf uses TCP.
To keep a good link quality, the packet loss should not go over 1 %. A high packet loss rate will generate a lot of TCP segment retransmissions which will affect the bandwidth.
The jitter is basically the latency variation and does not depend on the latency. You can have high response times and a very low jitter. The jitter value is particularly important on network links supporting voice over IP (VoIP) because a high jitter can break a call.
The -b argument allows the allocation if the desired bandwidth. Client side:
| #iperf -c 10.1.1.1 -u -b 10m |
------------------------------------------------------------
Client connecting to 10.1.1.1, UDP port 5001
Sending 1470 byte datagrams
UDP buffer size: 108 KByte (default)
------------------------------------------------------------
[ 3] local 10.6.2.5 port 32781 connected with 10.1.1.1 port 5001
[ 3] 0.0-10.0 sec 11.8 MBytes 9.89 Mbits/sec
[ 3] Sent 8409 datagrams
[ 3] Server Report:
[ 3] 0.0-10.0 sec 11.8 MBytes 9.86 Mbits/sec 2.617 ms 9/ 8409 (0.11%) Server side:
| #iperf -s -u -i 1 |
------------------------------------------------------------
Server listening on UDP port 5001
Receiving 1470 byte datagrams
UDP buffer size: 8.00 KByte (default)
------------------------------------------------------------
[904] local 10.1.1.1 port 5001 connected with 10.6.2.5 port 32781
[ ID] Interval Transfer Bandwidth Jitter Lost/Total Datagrams
[904] 0.0- 1.0 sec 1.17 MBytes 9.84 Mbits/sec 1.830 ms 0/ 837 (0%)
[904] 1.0- 2.0 sec 1.18 MBytes 9.94 Mbits/sec 1.846 ms 5/ 850 (0.59%)
[904] 2.0- 3.0 sec 1.19 MBytes 9.98 Mbits/sec 1.802 ms 2/ 851 (0.24%)
[904] 3.0- 4.0 sec 1.19 MBytes 10.0 Mbits/sec 1.830 ms 0/ 850 (0%)
[904] 4.0- 5.0 sec 1.19 MBytes 9.98 Mbits/sec 1.846 ms 1/ 850 (0.12%)
[904] 5.0- 6.0 sec 1.19 MBytes 10.0 Mbits/sec 1.806 ms 0/ 851 (0%)
[904] 6.0- 7.0 sec 1.06 MBytes 8.87 Mbits/sec 1.803 ms 1/ 755 (0.13%)
[904] 7.0- 8.0 sec 1.19 MBytes 10.0 Mbits/sec 1.831 ms 0/ 850 (0%)
[904] 8.0- 9.0 sec 1.19 MBytes 10.0 Mbits/sec 1.841 ms 0/ 850 (0%)
[904] 9.0-10.0 sec 1.19 MBytes 10.0 Mbits/sec 1.801 ms 0/ 851 (0%)
[904] 0.0-10.0 sec 11.8 MBytes 9.86 Mbits/sec 2.618 ms 9/ 8409 (0.11%) Top of the page
Maximum Segment Size (-m argument) display:
The Maximum Segment Size (MSS) is the largest amount of data, in bytes, that a computer can support in a single, unfragmented TCP segment.
It can be calculated as follows:
MSS = MTU - TCP & IP headers
The TCP & IP headers are equal to 40 bytes.
The MTU or Maximum Transmission Unit is the greatest amount of data that can be transferred in a frame.
Here are some default MTU size for different network topology:
Ethernet - 1500 bytes: used in a LAN.
PPPoE - 1492 bytes: used on ADSL links.
Token Ring (16Mb/sec) - 17914 bytes: old technology developed by IBM.
Dial-up - 576 bytes
Generally, a higher MTU (and MSS) brings higher bandwidth efficiency Client side:
| #iperf -c 10.1.1.1 -m |
------------------------------------------------------------
Client connecting to 10.1.1.1, TCP port 5001
TCP window size: 16.0 KByte (default)
------------------------------------------------------------
[ 3] local 10.6.2.5 port 41532 connected with 10.1.1.1 port 5001
[ 3] 0.0-10.2 sec 1.27 MBytes 1.04 Mbits/sec
[ 3] MSS size 1448 bytes (MTU 1500 bytes, ethernet)
Here the MSS is not equal to 1500 - 40 but to 1500 - 40 - 12 (Timestamps option) = 1448 Server side:
| #iperf -s |
Maximum Segment Size (-M argument) settings:
Use the -M argument to change the MSS. (See the previous test for more explanations about the MSS)
| #iperf -c 10.1.1.1 -M 1300 -m |
WARNING: attempt to set TCP maximum segment size to , but got 536
------------------------------------------------------------
Client connecting to 10.1.1.1, TCP port 5001
TCP window size: 16.0 KByte (default)
------------------------------------------------------------
[ 3] local 10.6.2.5 port 41533 connected with 10.1.1.1 port 5001
[ 3] 0.0-10.1 sec 4.29 MBytes 3.58 Mbits/sec
[ 3] MSS size 1288 bytes (MTU 1328 bytes, unknown interface) Server side:
| #iperf -s |
Parallel tests (-P argument):
Use the -P argument to run parallel tests. Client side:
| #iperf -c 10.1.1.1 -P 2 |
------------------------------------------------------------
Client connecting to 10.1.1.1, TCP port 5001
TCP window size: 16.0 KByte (default)
------------------------------------------------------------
[ 3] local 10.6.2.5 port 41534 connected with 10.1.1.1 port 5001
[ 4] local 10.6.2.5 port 41535 connected with 10.1.1.1 port 5001
[ 4] 0.0-10.1 sec 1.35 MBytes 1.12 Mbits/sec
[ 3] 0.0-10.1 sec 1.35 MBytes 1.12 Mbits/sec
[SUM] 0.0-10.1 sec 2.70 MBytes 2.24 Mbits/sec Server side:
| #iperf -s |
Iperf help:
| #iperf -h |
Usage: iperf [-s|-c host] [options]
iperf [-h|--help] [-v|--version]
Client/Server:
| -f -i -l -m -p -u -w -B -C -M -N -V |
--format --interval --len --print_mss --port --udp --window --bind --compatibility --mss --nodelay --IPv6Version |
[kmKM] # #[KM] # #[KM] "host" # |
format to report: Kbits, Mbits, KBytes, MBytes seconds between periodic bandwidth reports length of buffer to read or write (default 8 KB) print TCP maximum segment size (MTU - TCP/IP header) server port to listen on/connect to use UDP rather than TCP TCP window size (socket buffer size) bind to "host", an interface or multicast address for use with older versions does not sent extra msgs set TCP maximum segment size (MTU - 40 bytes) set TCP no delay, disabling Nagle's Algorithm Set the domain to IPv6 |
Server specific:
| -s -U -D |
--server --single_udp --daemon |
|
run in server mode run in single threaded UDP mode run the server as a daemon |
Client specific:
| -b -c -d -n -r -t -F -I -L -P -T |
--bandwidth --client --dualtest --num --tradeoff --time --fileinput --stdin --listenport --parallel --ttl |
#[KM] "host" #[KM] # "name" # # # |
for UDP, bandwidth to send at in bits/sec (default 1 Mbit/sec, implies -u) run in client mode, connecting to "host" Do a bidirectional test simultaneously number of bytes to transmit (instead of -t) Do a bidirectional test individually time in seconds to transmit for (default 10 secs) input the data to be transmitted from a file input the data to be transmitted from stdin port to recieve bidirectional tests back on number of parallel client threads to run time-to-live, for multicast (default 1) |
Miscellaneous:
| -h -v |
--help --version |
|
print this message and quit print version information and quit |
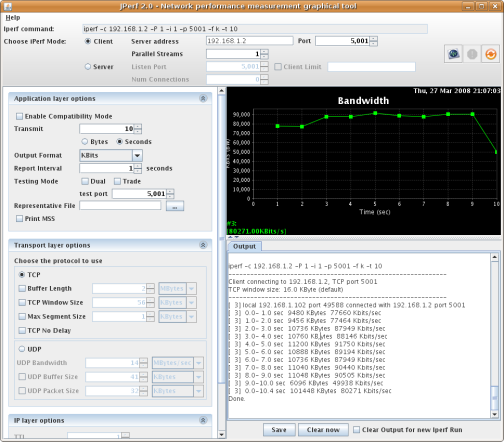
JPERF
Jperf is a graphical frontend for Iperf written in Java.
1. Installation:
Download Jperf. Linux
Uncompress the downloaded file:
| #tar -xvf jperf2.0.0.zip |
Launch Jperf.
| #cd jperf2.0.0 #./jperf.sh |
If you have the following message, it means that you need to install Iperf with: "apt-get install iperf"
Iperf is probably not in your Path!
Please download it here 'http://dast.nlanr.net/Projects/Iperf/'
and put the executable in your PATH environment variable.
 |
Microsoft Windows
Uncompress the downloaded file with your favorite program.
Access the uncompressed folder called by default "jperf2.0.0" and double-click on "jperf.bat".
Note that the iperf utility is already present in the /bin folder.
2. Examples: Default settings, bandwidth measurement:
Also check "Iperf" section for more details.
- Linux client:
 |
- Windows server:
 |
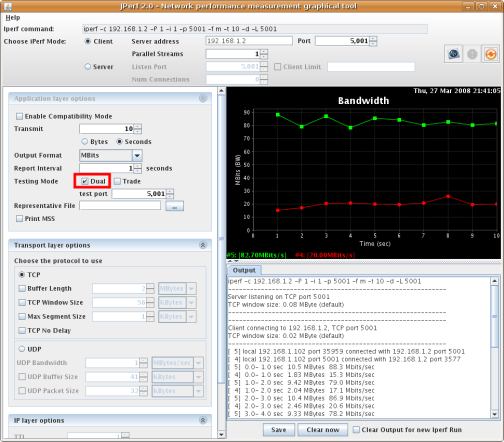
Simultaneous bi-directional bandwidth measurement:
Also check "Iperf" section for more details.
- Linux client:
 |
- Windows server:
 |
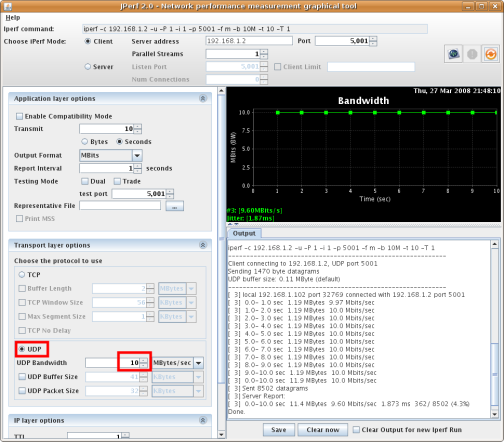
Top of the page Jperf Jitter measurement:
Also check "Iperf" section for more details.
- Linux client:
 |
- Windows server:
 |
Iperf[转]的更多相关文章
- mininet中iperf sever自动退出
使用iperf 在mininet进行吞吐量测试是常用的方法,之前结束iperf server的方法是运行os.system('pkill iperf')命令. 但是这种方式iperf server有可 ...
- Linux 下测试网卡性能命令iperf 的用法
很多文件系统都自带iperf 命令,所以不用作多的移植工作. 如下查看他的帮助信息. Qt@aplex:~$ iperf -h Usage: iperf [-s|-c host] [options] ...
- iperf交叉编译:
下载:http://sourceforge.net/projects/iperf 1. 先把iperf-2.0.4.tar.gz解压到你的目录下.2. cd iperf-2.0.43. ./confi ...
- Ubuntu下iperf的安装
(1)下载 链接:http://sourceforge.net/projects/iperf/files/?source=navbar 资源:iperf-2.0.5.tar.gz (2)解压 #t ...
- 利用netperf、iperf、mtr测试网络
1.netperf安装和使用 netperf安装 # tar -xzvf netperf-.tar.gz # cd netperf- # ./configure # make # make insta ...
- 网络性能测试工具iperf详细使用图文教程
Iperf是一个网络性能测试工具.Iperf可以测试TCP和UDP带宽质量.Iperf可以测量最大TCP带宽,具有多种参数和UDP特性. Iperf可以报告带宽,延迟抖动和数据包丢失.利用Iper ...
- iperf测试
在服务端运行iperf,输入命令iperf –s –p 12345 –i 1 –M 以在本机端口12345上启用iperf 在客户端运行iperf,输入命令iperf –c server-ip –p ...
- 网络性能测试工具iperf详细使用图文教程【转载】
原文:http://blog.163.com/hlz_2599/blog/static/142378474201341341339314/ 参考:http://man.linuxde.net/iper ...
- iPerf - The network bandwidth measurement tool
What is iPerf / iPerf3 ? iPerf3 is a tool for active measurements of the maximum achievable bandwidt ...
- Iperf使用方法
Iperf使用方法 Iperf 是一个网络性能测试工具.Iperf可以测试TCP和UDP带宽质量.Iperf可以测量最大TCP带宽,具有多种参数和UDP特性.Iperf可以报告带宽,延迟抖动和数据包 ...
随机推荐
- javascript模仿块级作用域(第一篇)
作用域有词法作用域和块级作用域之分,javascript属于词法作用域,而在java.C++中却是块级作用域.在javascript中,只有函数能够创建作用域,作用域是以function作为边界的. ...
- c#自带压缩类实现数据库表导出到CSV压缩文件
c#自带压缩类实现数据库表导出到CSV压缩文件的方法 在导出大量CSV数据的时候,常常体积较大,采用C#自带的压缩类,可以方便的实现该功能,并且压缩比例很高,该方法在我的开源工具DataPie中已经经 ...
- 仿async/await(一)and Gulp:新一代前端构建利器
NET 4.5的async/await真是个神奇的东西,巧妙异常以致我不禁对其实现充满好奇,但一直难以窥探其门径.不意间读了此篇强文<Asynchronous Programming in C# ...
- IOS UI 第一篇:基本UI
1. UI 书写 最基本创建一个label 标签 写一个first rate : UILabel *label = [[UILabel alloc] initWithFrame:CGRect ...
- C#伪彩色处理
伪彩色处理是指将灰度图像转换成彩色图象.因为人眼对于彩色的分辨能力远高于对灰度图像的分辨能力,所以将灰度图像转换成彩色可以提高人眼对图像细节的辨别能力.伪彩色并不能真实的反映图像像的彩色情况. 效果图 ...
- C/C++基础知识总结——C++简单程序设计
1. sizeof 1.1 sizeof(类型名) 1.2 sizeof 表达式 1.3 返回所占字节大小 2. I/O流的输出格式 2.1 常用I/O流库操纵符 dec 十进制 he ...
- HDU 4618 - Palindrome Sub-Array(2013MUTC2-1008)(DP)
d(i,j,k)表示左上角坐标为(i,j),k为正方形边长 d(i,j,k)=1,如果d(i+1,j+1,k-2)=0,且上下两个外围的相等且回文,左右两个外围的相等且回文:否则d(i,j,k)=0 ...
- Linux环境fork()函数详解
Linux环境fork()函数详解 引言 先来看一段代码吧, 1 #include <sys/types.h> 2 #include <unistd.h> 3 #include ...
- jQuery Fancybox插件介绍
下面介绍一款jquery图片播放插件叫Fancybox,项目主页地址:http://fancybox.net/ Fancybox的特点如下: 1.可以支持图片.html文本.flash动画.ifram ...
- Java笔记:String类
1.String类是不可变类,一旦一个String对象被创建以后,包含在这个对象中的字符序列式不可改变的,直至这个对象被销毁. String s1 = "java"; s1 = s ...