吴裕雄--天生自然python机器学习:Logistic回归
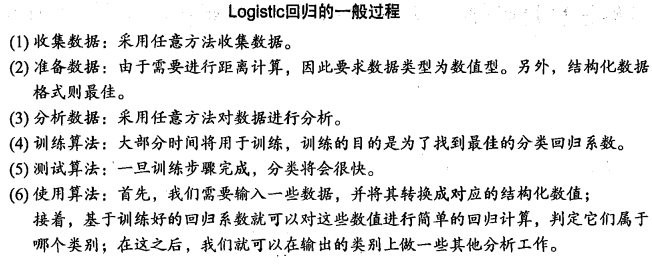
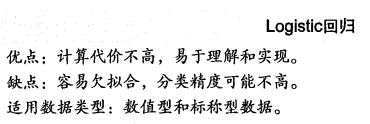
假设现在有一些数据点,我们用
一条直线对这些点进行拟合(该线称为最佳拟合直线),这个拟合过程就称作回归。利用Logistic
回归进行分类的主要思想是:根据现有数据对分类边界线建立回归公式,以此进行分类。这里的
“ 回归” 一词源于最佳拟合,表示要找到最佳拟合参数集。
训练分类器时的做法就是寻找最佳拟合参数,使用的是最优化算法。
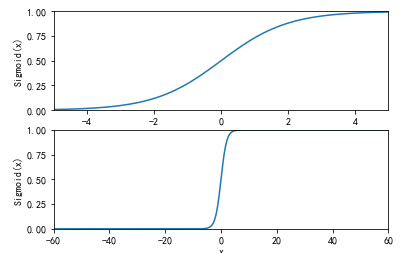
基于Logistic回归和Sigmoid函数的分类

import sys

from pylab import *

t = arange(-60.0, 60.3, 0.1)

s = 1/(1 + exp(-t))

ax = subplot(211)

ax.plot(t,s)

ax.axis([-5,5,0,1])

plt.xlabel('x')

plt.ylabel('Sigmoid(x)')

ax = subplot(212)

ax.plot(t,s)

ax.axis([-60,60,0,1])

plt.xlabel('x')

plt.ylabel('Sigmoid(x)')

show()

基于最优化方法的最佳回归系数确定

梯度上升法
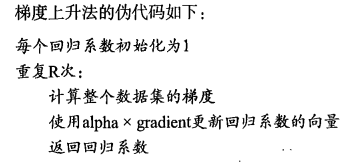
梯度上升法基于的思想是:要找到某函数的
最大值,最好的方法是沿着该函数的梯度方向探寻。

import matplotlib

import numpy as np

import matplotlib.cm as cm

import matplotlib.mlab as mlab

import matplotlib.pyplot as plt

leafNode = dict(boxstyle="round4", fc="0.8")

arrow_args = dict(arrowstyle="<-")

matplotlib.rcParams['xtick.direction'] = 'out'

matplotlib.rcParams['ytick.direction'] = 'out'

delta = 0.025

x = np.arange(-2.0, 2.0, delta)

y = np.arange(-2.0, 2.0, delta)

X, Y = np.meshgrid(x, y)

Z1 = -((X-1)**2)

Z2 = -(Y**2)

#Z1 = mlab.bivariate_normal(X, Y, 1.0, 1.0, 0.0, 0.0)

#Z2 = mlab.bivariate_normal(X, Y, 1.5, 0.5, 1, 1)

# difference of Gaussians

Z = 1.0 * (Z2 + Z1)+5.0

# Create a simple contour plot with labels using default colors.  The

# inline argument to clabel will control whether the labels are draw

# over the line segments of the contour, removing the lines beneath

# the label

plt.figure()

CS = plt.contour(X, Y, Z)

plt.annotate('', xy=(0.05, 0.05),  xycoords='axes fraction',xytext=(0.2,0.2), textcoords='axes fraction',va="center", ha="center", bbox=leafNode, arrowprops=arrow_args )

plt.text(-1.9, -1.8, 'P0')

plt.annotate('', xy=(0.2,0.2),  xycoords='axes fraction',xytext=(0.35,0.3), textcoords='axes fraction',va="center", ha="center", bbox=leafNode, arrowprops=arrow_args )

plt.text(-1.35, -1.23, 'P1')

plt.annotate('', xy=(0.35,0.3),  xycoords='axes fraction',xytext=(0.45,0.35), textcoords='axes fraction',va="center", ha="center", bbox=leafNode, arrowprops=arrow_args )

plt.text(-0.7, -0.8, 'P2')

plt.text(-0.3, -0.6, 'P3')

plt.clabel(CS, inline=1, fontsize=10)

plt.title('Gradient Ascent')

plt.xlabel('x')

plt.ylabel('y')

plt.show()
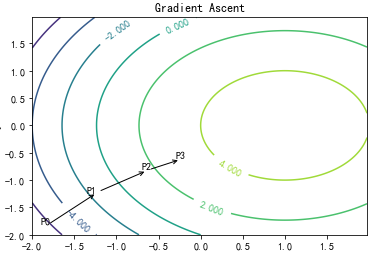

可以看到,梯度算子总是指向函数值增长
最快的方向。这里所说的是移动方向,而未提到移动量的大小。该量值称为步长,记做a用向
量来表示的话,梯度算法的迭代公式如下:


训练算法:使用梯度上升找到最佳参数
from numpy import *

def loadDataSet():

    dataMat = []; labelMat = []

    fr = open('testSet.txt')

    for line in fr.readlines():

        lineArr = line.strip().split()

        dataMat.append([1.0, float(lineArr[0]), float(lineArr[1])])

        labelMat.append(int(lineArr[2]))

    return dataMat,labelMat

def sigmoid(inX):

    return 1.0/(1+exp(-inX))

def gradAscent(dataMatIn, classLabels):

    dataMatrix = mat(dataMatIn)             #convert to NumPy matrix

    labelMat = mat(classLabels).transpose() #convert to NumPy matrix

    m,n = shape(dataMatrix)

    alpha = 0.001

    maxCycles = 500

    weights = ones((n,1))

    for k in range(maxCycles):              #heavy on matrix operations

        h = sigmoid(dataMatrix*weights)     #matrix mult

        error = (labelMat - h)              #vector subtraction

        weights = weights + alpha * dataMatrix.transpose()* error #matrix mult

    return weights
dataMat,labelMat = loadDataSet()

weights = gradAscent(dataMat,labelMat)

print(weights)

分析数据:画出决策边界
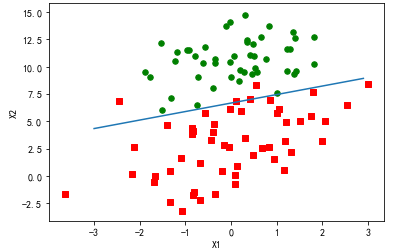
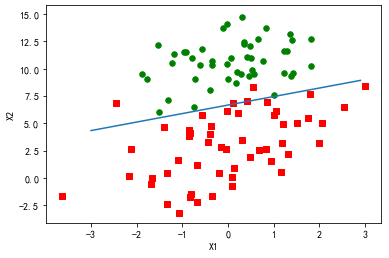
上面已经解出了一组回归系数,它确定了不同类别数据之间的分隔线。
import matplotlib

import matplotlib.pyplot as plt

from numpy import *

from matplotlib.patches import Rectangle

def loadDataSet():

    dataMat = []

    labelMat = []

    fr = open('F:\\machinelearninginaction\\Ch05\\testSet.txt')

    for line in fr.readlines():

        lineArr = line.strip().split()

        dataMat.append([1.0, float(lineArr[0]), float(lineArr[1])])

        labelMat.append(int(lineArr[2]))

    return dataMat,labelMat

def sigmoid(inX):

    return 1.0/(1+exp(-inX))

def stocGradAscent0(dataMatrix, classLabels):

    m,n = shape(dataMatrix)

    alpha = 0.01

    weights = ones(n)   #initialize to all ones

    for i in range(m):

        h = sigmoid(sum(dataMatrix[i]*weights))

        error = classLabels[i] - h

        weights = weights + alpha * error * dataMatrix[i]

    return weights

def gradAscent(dataMatIn, classLabels):

    dataMatrix = mat(dataMatIn)             #convert to NumPy matrix

    labelMat = mat(classLabels).transpose() #convert to NumPy matrix

    m,n = shape(dataMatrix)

    alpha = 0.001

    maxCycles = 500

    weights = ones((n,1))

    for k in range(maxCycles):              #heavy on matrix operations

        h = sigmoid(dataMatrix*weights)     #matrix mult

        error = (labelMat - h)              #vector subtraction

        weights = weights + alpha * dataMatrix.transpose()* error #matrix mult

    return weights

dataMat,labelMat=loadDataSet()

dataArr = array(dataMat)

weights = gradAscent(dataArr,labelMat)

n = shape(dataArr)[0] #number of points to create

xcord1 = []

ycord1 = []

xcord2 = []

ycord2 = []

markers =[]

colors =[]

for i in range(n):

    if int(labelMat[i])== 1:

        xcord1.append(dataArr[i,1]); ycord1.append(dataArr[i,2])

    else:

        xcord2.append(dataArr[i,1]); ycord2.append(dataArr[i,2])

fig = plt.figure()

ax = fig.add_subplot(111)

#ax.scatter(xcord,ycord, c=colors, s=markers)

type1 = ax.scatter(xcord1, ycord1, s=30, c='red', marker='s')

type2 = ax.scatter(xcord2, ycord2, s=30, c='green')

x = arange(-3.0, 3.0, 0.1)

#weights = [-2.9, 0.72, 1.29]

#weights = [-5, 1.09, 1.42]

weights = [13.03822793,   1.32877317,  -1.96702074]

weights = [4.12,   0.48,  -0.6168]

y = (-weights[0]-weights[1]*x)/weights[2]

type3 = ax.plot(x, y)

#ax.legend([type1, type2, type3], ["Did Not Like", "Liked in Small Doses", "Liked in Large Doses"], loc=2)

#ax.axis([-5000,100000,-2,25])

plt.xlabel('X1')

plt.ylabel('X2')

plt.show()
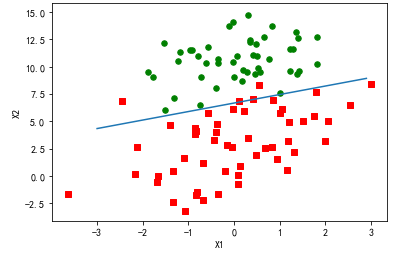
训练算法:随机梯度上升

def stocGradAscent0(dataMatrix, classLabels):

    m,n = shape(dataMatrix)

    alpha = 0.01

    weights = ones(n)   #initialize to all ones

    for i in range(m):

        h = sigmoid(sum(dataMatrix[i]*weights))

        error = classLabels[i] - h

        weights = weights + alpha * error * dataMatrix[i]

    return weights
import matplotlib

import matplotlib.pyplot as plt

from numpy import *

from matplotlib.patches import Rectangle

def loadDataSet():

    dataMat = []

    labelMat = []

    fr = open('F:\\machinelearninginaction\\Ch05\\testSet.txt')

    for line in fr.readlines():

        lineArr = line.strip().split()

        dataMat.append([1.0, float(lineArr[0]), float(lineArr[1])])

        labelMat.append(int(lineArr[2]))

    return dataMat,labelMat

def sigmoid(inX):

    return 1.0/(1+exp(-inX))

def stocGradAscent0(dataMatrix, classLabels):

    m,n = shape(dataMatrix)

    alpha = 0.01

    weights = ones(n)   #initialize to all ones

    for i in range(m):

        h = sigmoid(sum(dataMatrix[i]*weights))

        error = classLabels[i] - h

        weights = weights + alpha * error * dataMatrix[i]

    return weights

def gradAscent(dataMatIn, classLabels):

    dataMatrix = mat(dataMatIn)             #convert to NumPy matrix

    labelMat = mat(classLabels).transpose() #convert to NumPy matrix

    m,n = shape(dataMatrix)

    alpha = 0.001

    maxCycles = 500

    weights = ones((n,1))

    for k in range(maxCycles):              #heavy on matrix operations

        h = sigmoid(dataMatrix*weights)     #matrix mult

        error = (labelMat - h)              #vector subtraction

        weights = weights + alpha * dataMatrix.transpose()* error #matrix mult

    return weights

dataMat,labelMat=loadDataSet()

dataArr = array(dataMat)

weights = stocGradAscent0(dataArr,labelMat)

n = shape(dataArr)[0] #number of points to create

xcord1 = []

ycord1 = []

xcord2 = []

ycord2 = []

markers =[]

colors =[]

for i in range(n):

    if int(labelMat[i])== 1:

        xcord1.append(dataArr[i,1]); ycord1.append(dataArr[i,2])

    else:

        xcord2.append(dataArr[i,1]); ycord2.append(dataArr[i,2])

fig = plt.figure()

ax = fig.add_subplot(111)

#ax.scatter(xcord,ycord, c=colors, s=markers)

type1 = ax.scatter(xcord1, ycord1, s=30, c='red', marker='s')

type2 = ax.scatter(xcord2, ycord2, s=30, c='green')

x = arange(-3.0, 3.0, 0.1)

#weights = [-2.9, 0.72, 1.29]

#weights = [-5, 1.09, 1.42]

weights = [13.03822793,   1.32877317,  -1.96702074]

weights = [4.12,   0.48,  -0.6168]

y = (-weights[0]-weights[1]*x)/weights[2]

type3 = ax.plot(x, y)

#ax.legend([type1, type2, type3], ["Did Not Like", "Liked in Small Doses", "Liked in Large Doses"], loc=2)

#ax.axis([-5000,100000,-2,25])

plt.xlabel('X1')

plt.ylabel('X2')

plt.show()
import matplotlib

import matplotlib.pyplot as plt

from numpy import *

from matplotlib.patches import Rectangle

def loadDataSet():

    dataMat = []

    labelMat = []

    fr = open('F:\\machinelearninginaction\\Ch05\\testSet.txt')

    for line in fr.readlines():

        lineArr = line.strip().split()

        dataMat.append([1.0, float(lineArr[0]), float(lineArr[1])])

        labelMat.append(int(lineArr[2]))

    return dataMat,labelMat

def sigmoid(inX):

    return 1.0/(1+exp(-inX))

def stocGradAscent0(dataMatrix, classLabels):

    m,n = shape(dataMatrix)

    alpha = 0.5

    weights = ones(n)   #initialize to all ones

    weightsHistory=zeros((500*m,n))

    for j in range(500):

        for i in range(m):

            h = sigmoid(sum(dataMatrix[i]*weights))

            error = classLabels[i] - h

            weights = weights + alpha * error * dataMatrix[i]

            weightsHistory[j*m + i,:] = weights

    return weightsHistory

def stocGradAscent1(dataMatrix, classLabels):

    m,n = shape(dataMatrix)

    alpha = 0.4

    weights = ones(n)   #initialize to all ones

    weightsHistory=zeros((40*m,n))

    for j in range(40):

        dataIndex = range(m)

        for i in range(m):

            alpha = 4/(1.0+j+i)+0.01

            randIndex = int(random.uniform(0,len(dataIndex)))

            h = sigmoid(sum(dataMatrix[randIndex]*weights))

            error = classLabels[randIndex] - h

            #print error

            weights = weights + alpha * error * dataMatrix[randIndex]

            weightsHistory[j*m + i,:] = weights

#             del(dataIndex[randIndex])

    print(weights)

    return weightsHistory

dataMat,labelMat=loadDataSet()

dataArr = array(dataMat)

myHist = stocGradAscent1(dataArr,labelMat)

n = shape(dataArr)[0] #number of points to create

xcord1 = []

ycord1 = []

xcord2 = []

ycord2 = []

markers =[]

colors =[]

fig = plt.figure()

ax = fig.add_subplot(311)

type1 = ax.plot(myHist[:,0])

plt.ylabel('X0')

ax = fig.add_subplot(312)

type1 = ax.plot(myHist[:,1])

plt.ylabel('X1')

ax = fig.add_subplot(313)

type1 = ax.plot(myHist[:,2])

plt.xlabel('iteration')

plt.ylabel('X2')

plt.show()
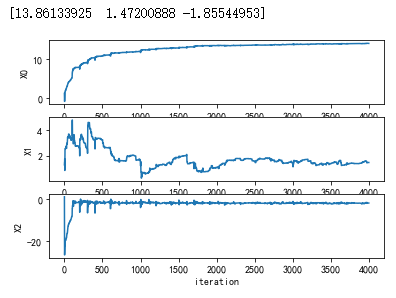

值 得注意的是,在大的波动停止后,还有一些小的周期性波动。不难理解,产生这种现象的原因是
存在一些不能正确分类的样本点(数据集并非线性可分),在每次迭代时会引发系数的剧烈改变。
我们期望算法能避免来回波动,从而收敛到某个值。另外,收敛速度也需要加快。
改进的随机梯度上升算法
def stocGradAscent1(dataMatrix, classLabels, numIter=150):

    m,n = shape(dataMatrix)

    weights = ones(n)   #initialize to all ones

    for j in range(numIter):

        dataIndex = range(m)

        for i in range(m):

            alpha = 4/(1.0+j+i)+0.0001    #apha decreases with iteration, does not

            randIndex = int(random.uniform(0,len(dataIndex)))#go to 0 because of the constant

            h = sigmoid(sum(dataMatrix[randIndex]*weights))

            error = classLabels[randIndex] - h

            weights = weights + alpha * error * dataMatrix[randIndex]

            del(dataIndex[randIndex])

    return weights
import matplotlib

import matplotlib.pyplot as plt

from numpy import *

from matplotlib.patches import Rectangle

def loadDataSet():

    dataMat = []

    labelMat = []

    fr = open('F:\\machinelearninginaction\\Ch05\\testSet.txt')

    for line in fr.readlines():

        lineArr = line.strip().split()

        dataMat.append([1.0, float(lineArr[0]), float(lineArr[1])])

        labelMat.append(int(lineArr[2]))

    return dataMat,labelMat

def sigmoid(inX):

    return 1.0/(1+exp(-inX))

def stocGradAscent0(dataMatrix, classLabels):

    m,n = shape(dataMatrix)

    alpha = 0.5

    weights = ones(n)   #initialize to all ones

    weightsHistory=zeros((500*m,n))

    for j in range(500):

        for i in range(m):

            h = sigmoid(sum(dataMatrix[i]*weights))

            error = classLabels[i] - h

            weights = weights + alpha * error * dataMatrix[i]

            weightsHistory[j*m + i,:] = weights

    return weightsHistory

def stocGradAscent1(dataMatrix, classLabels):

    m,n = shape(dataMatrix)

    alpha = 0.4

    weights = ones(n)   #initialize to all ones

    weightsHistory=zeros((40*m,n))

    for j in range(40):

        dataIndex = range(m)

        for i in range(m):

            alpha = 4/(1.0+j+i)+0.01

            randIndex = int(random.uniform(0,len(dataIndex)))

            h = sigmoid(sum(dataMatrix[randIndex]*weights))

            error = classLabels[randIndex] - h

            #print error

            weights = weights + alpha * error * dataMatrix[randIndex]

            weightsHistory[j*m + i,:] = weights

#             del(dataIndex[randIndex])

    print(weights)

    return weightsHistory

dataMat,labelMat=loadDataSet()

dataArr = array(dataMat)

myHist = stocGradAscent1(dataArr,labelMat)

n = shape(dataArr)[0] #number of points to create

xcord1 = []

ycord1 = []

xcord2 = []

ycord2 = []

markers =[]

colors =[]

fig = plt.figure()

ax = fig.add_subplot(311)

type1 = ax.plot(myHist[:,0])

plt.ylabel('X0')

ax = fig.add_subplot(312)

type1 = ax.plot(myHist[:,1])

plt.ylabel('X1')

ax = fig.add_subplot(313)

type1 = ax.plot(myHist[:,2])

plt.xlabel('iteration')

plt.ylabel('X2')

plt.show()

import matplotlib

import matplotlib.pyplot as plt

from numpy import *

from matplotlib.patches import Rectangle

def loadDataSet():

    dataMat = []

    labelMat = []

    fr = open('F:\\machinelearninginaction\\Ch05\\testSet.txt')

    for line in fr.readlines():

        lineArr = line.strip().split()

        dataMat.append([1.0, float(lineArr[0]), float(lineArr[1])])

        labelMat.append(int(lineArr[2]))

    return dataMat,labelMat

def sigmoid(inX):

    return 1.0/(1+exp(-inX))

def stocGradAscent0(dataMatrix, classLabels):

    m,n = shape(dataMatrix)

    alpha = 0.01

    weights = ones(n)   #initialize to all ones

    for i in range(m):

        h = sigmoid(sum(dataMatrix[i]*weights))

        error = classLabels[i] - h

        weights = weights + alpha * error * dataMatrix[i]

    return weights

def gradAscent(dataMatIn, classLabels):

    dataMatrix = mat(dataMatIn)             #convert to NumPy matrix

    labelMat = mat(classLabels).transpose() #convert to NumPy matrix

    m,n = shape(dataMatrix)

    alpha = 0.001

    maxCycles = 500

    weights = ones((n,1))

    for k in range(maxCycles):              #heavy on matrix operations

        h = sigmoid(dataMatrix*weights)     #matrix mult

        error = (labelMat - h)              #vector subtraction

        weights = weights + alpha * dataMatrix.transpose()* error #matrix mult

    return weights

def stocGradAscent1(dataMatrix, classLabels, numIter=150):

    m,n = shape(dataMatrix)

    weights = ones(n)   #initialize to all ones

    for j in range(numIter):

        dataIndex = range(m)

        for i in range(m):

            alpha = 4/(1.0+j+i)+0.0001    #apha decreases with iteration, does not

            randIndex = int(random.uniform(0,len(dataIndex)))#go to 0 because of the constant

            h = sigmoid(sum(dataMatrix[randIndex]*weights))

            error = classLabels[randIndex] - h

            weights = weights + alpha * error * dataMatrix[randIndex]

#             del(dataIndex[randIndex])

    return weights

dataMat,labelMat=loadDataSet()

dataArr = array(dataMat)

weights = stocGradAscent1(dataArr,labelMat)

n = shape(dataArr)[0] #number of points to create

xcord1 = []

ycord1 = []

xcord2 = []

ycord2 = []

markers =[]

colors =[]

for i in range(n):

    if int(labelMat[i])== 1:

        xcord1.append(dataArr[i,1]); ycord1.append(dataArr[i,2])

    else:

        xcord2.append(dataArr[i,1]); ycord2.append(dataArr[i,2])

fig = plt.figure()

ax = fig.add_subplot(111)

#ax.scatter(xcord,ycord, c=colors, s=markers)

type1 = ax.scatter(xcord1, ycord1, s=30, c='red', marker='s')

type2 = ax.scatter(xcord2, ycord2, s=30, c='green')

x = arange(-3.0, 3.0, 0.1)

#weights = [-2.9, 0.72, 1.29]

#weights = [-5, 1.09, 1.42]

weights = [13.03822793,   1.32877317,  -1.96702074]

weights = [4.12,   0.48,  -0.6168]

y = (-weights[0]-weights[1]*x)/weights[2]

type3 = ax.plot(x, y)

#ax.legend([type1, type2, type3], ["Did Not Like", "Liked in Small Doses", "Liked in Large Doses"], loc=2)

#ax.axis([-5000,100000,-2,25])

plt.xlabel('X1')

plt.ylabel('X2')

plt.show()
吴裕雄--天生自然python机器学习:Logistic回归的更多相关文章
- 吴裕雄--天生自然python机器学习:使用Logistic回归从疝气病症预测病马的死亡率
,除了部分指标主观和难以测量外,该数据还存在一个问题,数据集中有 30%的值是缺失的.下面将首先介绍如何处理数据集中的数据缺失问题,然 后 再 利 用 Logistic回 归 和随机梯度上升算法来预测 ...
- 吴裕雄--天生自然python机器学习实战:K-NN算法约会网站好友喜好预测以及手写数字预测分类实验
实验设备与软件环境 硬件环境:内存ddr3 4G及以上的x86架构主机一部 系统环境:windows 软件环境:Anaconda2(64位),python3.5,jupyter 内核版本:window ...
- 吴裕雄--天生自然python机器学习:朴素贝叶斯算法
分类器有时会产生错误结果,这时可以要求分类器给出一个最优的类别猜测结果,同 时给出这个猜测的概率估计值. 概率论是许多机器学习算法的基础 在计算 特征值取某个值的概率时涉及了一些概率知识,在那里我们先 ...
- 吴裕雄--天生自然python机器学习:决策树算法
我们经常使用决策树处理分类问题’近来的调查表明决策树也是最经常使用的数据挖掘算法. 它之所以如此流行,一个很重要的原因就是使用者基本上不用了解机器学习算法,也不用深究它 是如何工作的. K-近邻算法可 ...
- 吴裕雄--天生自然python机器学习:机器学习简介
除却一些无关紧要的情况,人们很难直接从原始数据本身获得所需信息.例如 ,对于垃圾邮 件的检测,侦测一个单词是否存在并没有太大的作用,然而当某几个特定单词同时出现时,再辅 以考察邮件长度及其他因素,人们 ...
- 吴裕雄--天生自然python机器学习:支持向量机SVM
基于最大间隔分隔数据 import matplotlib import matplotlib.pyplot as plt from numpy import * xcord0 = [] ycord0 ...
- 吴裕雄--天生自然python机器学习:使用K-近邻算法改进约会网站的配对效果
在约会网站使用K-近邻算法 准备数据:从文本文件中解析数据 海伦收集约会数据巳经有了一段时间,她把这些数据存放在文本文件(1如1^及抓 比加 中,每 个样本数据占据一行,总共有1000行.海伦的样本主 ...
- 吴裕雄--天生自然python机器学习:基于支持向量机SVM的手写数字识别
from numpy import * def img2vector(filename): returnVect = zeros((1,1024)) fr = open(filename) for i ...
- 吴裕雄--天生自然python机器学习:使用朴素贝叶斯过滤垃圾邮件
使用朴素贝叶斯解决一些现实生活中 的问题时,需要先从文本内容得到字符串列表,然后生成词向量. 准备数据:切分文本 测试算法:使用朴素贝叶斯进行交叉验证 文件解析及完整的垃圾邮件测试函数 def cre ...
随机推荐
- 获取网站IP地址(Linux,C)
#include <netdb.h> #include <stdio.h> #include <unistd.h> #include <stdlib.h> ...
- 读书笔记 - js高级程序设计 - 第五章 引用类型
引用类型 和 类 不是一个概念 用typeof来检测属性是否存在 typeof args.name == "string" 需要实验 访问属性的方法 .号和[] 一般情况下要 ...
- JS-表单验证二
3.范围验证:年龄范围验证: <head> <meta http-equiv="Content-Type" content="text/html; ch ...
- spark与Scala版本对应问题
在阅读一些博客和资料中,发现安装spark与Scala是要严格遵守两者的版本对应关系,如果版本不对应会在之后的使用中出现许多问题. 在安装时,我们可以在spark的官网中查到对应的Scala版本号,如 ...
- try,catch,finally尝试(一个程序块多个catch)
曾学过c++,但是对这些异常捕捉不是很了解,通过别的编程语言了解 public class newclass { public static void main(String[] args) { tr ...
- IO流处理文件读取到字节数组,再从字节数组读取到文件,Java实现
package cn.zhang.io; import java.io.ByteArrayInputStream; import java.io.ByteArrayOutputStream; impo ...
- 最长特殊序列 II
最长特殊序列 II class Solution { boolean containsSub(String s,String p){ int i,j; for(i=0,j=0;i<p.lengt ...
- 2020/1/29 PHP代码审计之进一步学习XSS【持续更新】
0x00 上午学习了XSS漏洞,中午吃饭想了想,还是思考的太浅层了,这种老生常谈的东西对于现在的我意义不大.现在我需要的是思考.于是就有了这个随笔.在本文中,我会持续更新一些XSS的深入思考,payl ...
- php开启opcache
OPcache 通过将 PHP 脚本预编译的字节码存储到共享内存中来提升 PHP 的性能, 存储预编译字节码的好处就是 省去了每次加载和解析 PHP 脚本的开销. 一.php.ini配置opchche ...
- MyBatis从入门到精通(第6章):MyBatis 高级查询->6.1.2高级结果映射之一对多映射
jdk1.8.MyBatis3.4.6.MySQL数据库5.6.45.IntelliJ IDEA 2019.3.1 本章主要包含的内容为 MyBatis 的高级结果映射,主要处理数据库一对一.一对多的 ...
