[Debug] Diagnose a Slow Page Using Developer Tools
Your page is showing high CPU usage and spinning up your laptop fan, but nothing is visibly happening. What is it doing, and why is it so slow?
This lesson is a real-world performance diagnosis of this very page, right here on egghead. Two infinite (but hidden) animations were causing CPU usage to spike, and Chrome's Task Manager and Performance tools helped uncover the elements causing the problem. You'll see how to use the profiler to record a snapshot, and learn a trick for discovering animations running in the background.
There numbers of things you can do to detect a slow page
1. Check the CPU usage
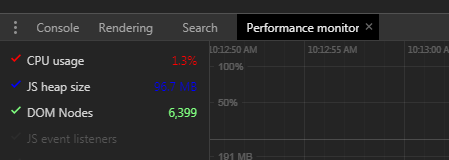
2. Bring up the chrome dev tool, performance monitor, pretty much you can say above 10% CPU usage is high
3. Record the Performance in dev tool to see any 'Layout' event, usually Layout event cause the DOM re-render, so we need to be carefully about this.
If there is such, check which element it is and try to solve the problem. For example, a hidden svg loading spinner, can cause the problem, we can set it to 'display: none', so it remove from the DOM
4. If there is any animation happens, we can do:
window.onanimationiteration = console.log
It will prints out when animation happens, so we can know that whether there is any unnecessary animation in the background.
[Debug] Diagnose a Slow Page Using Developer Tools的更多相关文章
- Can I prevent the Firefox developer tools network panel from clearing on page reload?
Can I prevent the Firefox developer tools network panel from clearing on page reload? I couldn't fin ...
- Developer tools
20. Developer tools Spring Boot includes an additional set of tools that can make the application de ...
- How to Build Office Developer Tools Projects with TFS Team Build 2012
Introduction Microsoft Visual Studio 2012 provides a new set of tools for developing apps for Office ...
- Chrome的开发者工具(Chrome Developer Tools)
Chrome的开发者工具(Chrome Developer Tools) 按F12 https://developer.chrome.com/devtools/index http://www.w3s ...
- 浏览器开发调试工具的秘密 - Secrets of the Browser Developer Tools
来源:GBin1.com 如果你是一个前端开发人员的话,正确的了解和使用浏览器开发工具是一个必须的技能. Secrets of the Browser Developer Tools是一个帮助大家了解 ...
- Chrome调试工具Developer Tools——前端必备神器
本文链接:https://blog.csdn.net/u012542647/article/details/79401485 今天要给大家介绍一个神器,就是谷歌浏览器(Chorme)自带的前端调试工具 ...
- Chrome Developer Tools:Network Panel说明
官方资料:Chrome Developer Tools: Network Panel 一.chrome Developer Tools:Network Panel 从网络面板中可以获取很多有用信息,如 ...
- eclipse中jsp文档无语法着色,安装Eclipse Java Web Developer Tools插件
一.安装Eclipse Java Web Developer Tools插件 1.eclipse菜单:help/install New Software,打开Available Software窗体: ...
- React Developer Tools 安装小提示
1,在google市场里边,安装React Developer Tools之后,发现是开启的,但是按下F12后,并没有发现react选项 2,后来通过查资料,发现必须是运行react项目的时候,才出现 ...
随机推荐
- 通过CLI命令将ESXi主机进入维护模式
将主机置于维护模式# vimsh -n -e /hostsvc/maintenance_mode_enter # vim-cmd /hostsvc/maintenance_mode_enter 退出维 ...
- PriorityQueue详解(一)
在Java SE 5.0中,引入了一些新的Collection API,PriorityQueue就是其中的一个.今天由于机缘巧合,花了一个小时看了一下这个类的内部实现,代码很有点意思,所以写下来跟大 ...
- 翻煎饼_简单模拟_C++
一.题目描述(懒人可直接跳过看题目概述) 题目来源: SWUST OJ 题目0254 http://acm.swust.edu.cn/problem/0254/ 二.问题概述 给出一列数,每次可将包 ...
- 【友盟统计报表解读】之错误分析iOS版
http://bbs.umeng.com/thread-6908-1-1.html 错误分析功能说明1.概述 错误分析是友盟为移动开发者提供的Crash收集和分析工具,帮助开发者监测App在移动设备上 ...
- 《Linux命令行与shell脚本编程大全 第3版》Shell脚本编程基础---57
以下为阅读<Linux命令行与shell脚本编程大全 第3版>的读书笔记,为了方便记录,特地与书的内容保持同步,特意做成一节一次随笔,特记录如下:
- C++ 采集音频流(PCM裸流)实现录音功能
与上一篇的“C++ 播放音频流(PCM裸流)” 点击打开链接 相对应,本篇是关于用C++实现录音功能的.同样是直接建一个win32控制台程序然后将代码拷过去改个文件名就可以用,也可以下载本人上传的相关 ...
- 引进js文件运行在浏览器上调试报文件找不到
原因是jsp文件的路径和js文件不在同一目录下,用"../"将它们的路径配置在同一路径下或者在路径前面加上"<%= request.getContextPath() ...
- 计蒜客 25985.Goldbach-米勒拉宾素数判定(大素数) (2018 ACM-ICPC 中国大学生程序设计竞赛线上赛 B)
若干年之前的一道题,当时能写出来还是超级开心的,虽然是个板子题.一直忘记写博客,备忘一下. 米勒拉判大素数,关于米勒拉宾是个什么东西,传送门了解一下:biubiubiu~ B. Goldbach 题目 ...
- struts2进阶
Struts2 一.Struts的工作原理 Struts2的工作机制3.1Struts2体系结构图 Strut2的体系结构如图15所示: (图15) 3.2Struts2的工作机制 从图15可以看出, ...
- SpringCloud简介(一)
一.SpringCloud简介 SpringCloud 为开发人员提供了快速构建分布式系统的一些工具,包括配置管理.服务发现.断路器.路由.负载均衡.微代理.事件总线.全局锁.决策竞选.分布式会话等等 ...