5 commands to check memory usage on Linux
Memory Usage
On linux, there are commands for almost everything, because the gui might not be always available. When working on servers only shell access is available and everything has to be done from these commands. So today we shall be checking the commands that can be used to check memory usage on a linux system. Memory include RAM and swap.
It is often important to check memory usage and memory used per process on servers so that resources do not fall short and users are able to access the server. For example a website. If you are running a webserver, then the server must have enough memory to serve the visitors to the site. If not, the site would become very slow or even go down when there is a traffic spike, simply because memory would fall short. Its just like what happens on your desktop PC.
1. free command
The free command is the most simple and easy to use command to check memory usage on linux. Here is a quick example
$ free -m

             total       used       free     shared    buffers     cached

Mem:          7976       6459       1517          0        865       2248

-/+ buffers/cache:       3344       4631

Swap:         1951          0       1951
The m option displays all data in MBs. The total os 7976 MB is the total amount of RAM installed on the system, that is 8GB. The used column shows the amount of RAM that has been used by linux, in this case around 6.4 GB. The output is pretty self explanatory. The catch over here is the cached and buffers column. The second line tells that 4.6 GB is free. This is the free memory in first line added with the buffers and cached amount of memory.
Linux has the habit of caching lots of things for faster performance, so that memory can be freed and used if needed.
The last line is the swap memory, which in this case is lying entirely free.
2. /proc/meminfo
The next way to check memory usage is to read the /proc/meminfo file.
Know that the /proc file system does not contain real files. They are
rather virtual files that contain dynamic information about the kernel
and the system.
$ cat /proc/meminfo

MemTotal:        8167848 kB

MemFree:         1409696 kB

Buffers:          961452 kB

Cached:          2347236 kB

SwapCached:            0 kB

Active:          3124752 kB

Inactive:        2781308 kB

Active(anon):    2603376 kB

Inactive(anon):   309056 kB

Active(file):     521376 kB

Inactive(file):  2472252 kB

Unevictable:        5864 kB

Mlocked:            5880 kB

SwapTotal:       1998844 kB

SwapFree:        1998844 kB

Dirty:              7180 kB

Writeback:             0 kB

AnonPages:       2603272 kB

Mapped:           788380 kB

Shmem:            311596 kB

Slab:             200468 kB

SReclaimable:     151760 kB

SUnreclaim:        48708 kB

KernelStack:        6488 kB

PageTables:        78592 kB

NFS_Unstable:          0 kB

Bounce:                0 kB

WritebackTmp:          0 kB

CommitLimit:     6082768 kB

Committed_AS:    9397536 kB

VmallocTotal:   34359738367 kB

VmallocUsed:      420204 kB

VmallocChunk:   34359311104 kB

HardwareCorrupted:     0 kB

AnonHugePages:         0 kB

HugePages_Total:       0

HugePages_Free:        0

HugePages_Rsvd:        0

HugePages_Surp:        0

Hugepagesize:       2048 kB

DirectMap4k:       62464 kB

DirectMap2M:     8316928 kB
Check the values of MemTotal, MemFree, Buffers, Cached, SwapTotal, SwapFree.
They indicate same values of memory usage as the free command.
3. vmstat
The vmstat command with the s option, lays out the memory usage statistics much like the proc command. Here is an example
$ vmstat -s

      8167848 K total memory

      7449376 K used memory

      3423872 K active memory

      3140312 K inactive memory

       718472 K free memory

      1154464 K buffer memory

      2422876 K swap cache

      1998844 K total swap

            0 K used swap

      1998844 K free swap

       392650 non-nice user cpu ticks

         8073 nice user cpu ticks

        83959 system cpu ticks

     10448341 idle cpu ticks

        91904 IO-wait cpu ticks

            0 IRQ cpu ticks

         2189 softirq cpu ticks

            0 stolen cpu ticks

      2042603 pages paged in

      2614057 pages paged out

            0 pages swapped in

            0 pages swapped out

     42301605 interrupts

     94581566 CPU context switches

   1382755972 boot time

         8567 forks

$
The top few lines indicate total memory, free memory etc and so on.
4. top command
The top command is generally used to check memory and cpu usage per process. However it also reports total memory usage and can be used to monitor the total RAM usage. The header on output has the required information. Here is a sample output
top - 15:20:30 up  6:57,  5 users,  load average: 0.64, 0.44, 0.33

Tasks: 265 total,   1 running, 263 sleeping,   0 stopped,   1 zombie

%Cpu(s):  7.8 us,  2.4 sy,  0.0 ni, 88.9 id,  0.9 wa,  0.0 hi,  0.0 si,  0.0 st

KiB Mem:   8167848 total,  6642360 used,  1525488 free,  1026876 buffers

KiB Swap:  1998844 total,        0 used,  1998844 free,  2138148 cached

  PID USER      PR  NI  VIRT  RES  SHR S  %CPU %MEM    TIME+  COMMAND

 2986 enlighte  20   0  584m  42m  26m S  14.3  0.5   0:44.27 yakuake

 1305 root      20   0  448m  68m  39m S   5.0  0.9   3:33.98 Xorg

 7701 enlighte  20   0  424m  17m  10m S   4.0  0.2   0:00.12 kio_thumbnail
Check the KiB Mem and KiB Swap lines on the header. They indicate total, used and free amounts of the memory. The buffer and cache information is present here too, like the free command.
5. htop
Similar to the top command, the htop command also shows memory usage along with various other details.
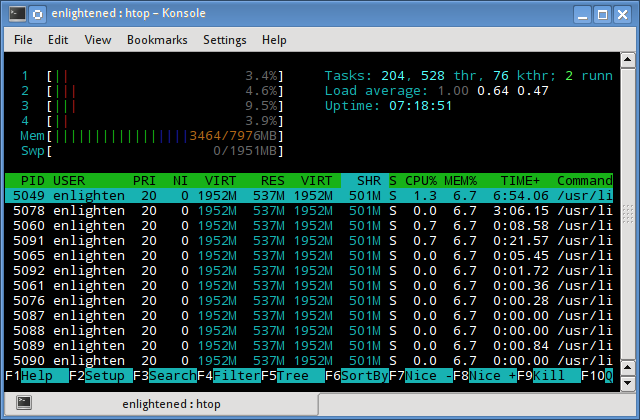
The header on top shows cpu usage along with RAM and swap usage with the corresponding figures.
RAM Information
To find out hardware information about the installed RAM, use the demidecode command. It reports lots of information about the installed RAM memory.
$ sudo dmidecode -t 17

# dmidecode 2.11

SMBIOS 2.4 present.

Handle 0x0015, DMI type 17, 27 bytes

Memory Device

        Array Handle: 0x0014

        Error Information Handle: Not Provided

        Total Width: 64 bits

        Data Width: 64 bits

        Size: 2048 MB

        Form Factor: DIMM

        Set: None

        Locator: J1MY

        Bank Locator: CHAN A DIMM 0

        Type: DDR2

        Type Detail: Synchronous

        Speed: 667 MHz

        Manufacturer: 0xFF00000000000000

        Serial Number: 0xFFFFFFFF

        Asset Tag: Unknown

        Part Number: 0x524D32474235383443412D36344643FFFFFF
Provided information includes the size (2048MB), type (DDR2) , speed(667 Mhz) etc.
Summary
All the above mentioned commands work from the terminal and do not have a gui. When working on a desktop with a gui, it is much easier to use a GUI tool with graphical output. The most common tools are gnome-system-monitor on gnome and
ksysguard on KDE. Both provide resource usage information about cpu,
ram, swap and network bandwidth in a graphical and easy to understand
visual output.
5 commands to check memory usage on Linux的更多相关文章
- SHELL:Find Memory Usage In Linux (统计每个程序内存使用情况)
转载一个shell统计linux系统中每个程序的内存使用情况,因为内存结构非常复杂,不一定100%精确,此shell可以在Ghub上下载. [root@db231 ~]# ./memstat.sh P ...
- 12 Useful “df” Commands to Check Disk Space in Linux
On the internet you will find plenty of tools for checking disk space utilization in Linux. However, ...
- 8 commands to check cpu information on Linux
https://www.binarytides.com/linux-cpu-information/
- Shell script for logging cpu and memory usage of a Linux process
Shell script for logging cpu and memory usage of a Linux process http://www.unix.com/shell-programmi ...
- 10 Useful du (Disk Usage) Commands to Find Disk Usage of Files and Directories
The Linux “du” (Disk Usage) is a standard Unix/Linux command, used to check the information of disk ...
- Reducing and Profiling GPU Memory Usage in Keras with TensorFlow Backend
keras 自适应分配显存 & 清理不用的变量释放 GPU 显存 Intro Are you running out of GPU memory when using keras or ten ...
- detect data races The cost of race detection varies by program, but for a typical program, memory usage may increase by 5-10x and execution time by 2-20x.
小结: 1. conflicting access 2.性能危害 优化 The cost of race detection varies by program, but for a typical ...
- Why does the memory usage increase when I redeploy a web application?
That is because your web application has a memory leak. A common issue are "PermGen" memor ...
- GPU Memory Usage占满而GPU-Util却为0的调试
最近使用github上的一个开源项目训练基于CNN的翻译模型,使用THEANO_FLAGS='floatX=float32,device=gpu2,lib.cnmem=1' python run_nn ...
随机推荐
- Feature Stapling in SharePoint 2010
http://msdn.microsoft.com/en-us/library/bb861862(v=office.12).aspx http://gallery.technet.microsoft. ...
- Android开发应用异步检查更新代码
开发环境:android studio sdk 4.0及以上 场景:用户点击检查更新按钮进行检查服务器版本号,若有新版本则进行下载更新.异步检测版本号 package com.example.q ...
- 文件中的类都不能进行设计,因此未能为该文件显示设计器。设计器检查出文件中有以下类: FormMain --- 未能加载基类“WinForm.Win.FormsBase.FormMainBase”。请确保已引用该程序集并已生成所有项目
出现该问题的原因:FormMain从FormMainBase继承之后,一旦修改FormMainBase就会出现这个问题 解决方案:(1-4是搜索网友的) 1: 关闭VS所有窗口,后重启.即可返回正常. ...
- android编程常见问题-No Launcher activity found!
新手编程常见的问题: 问题表现: console提示:No Launcher activity found! The launch will only sync the application pac ...
- PHP中应用Service Locator服务定位及单例模式
单例模式将一个对象实例化后,放在静态变量中,供程序调用. 服务定位(ServiceLocator)就是对象工场Factory,调用者对象直接调用Service Locator,与被调用对象减轻了依赖关 ...
- 【HDOJ】【3853】LOOPS
概率DP/数学期望 kuangbin总结中的第7题 其实跟UVA 11762 Race To 1 那道题差不多……直接推下公式,然后倒推即可 Trick:有的点可能是p1[i][j]==1……这样的点 ...
- PAT-乙级-1054. 求平均值 (20)
1054. 求平均值 (20) 时间限制 400 ms 内存限制 65536 kB 代码长度限制 8000 B 判题程序 Standard 作者 CHEN, Yue 本题的基本要求非常简单:给定N个实 ...
- Socket 阻塞模式和非阻塞模式
阻塞I/O模型: 简介:进程会一直阻塞,直到数据拷贝 完成 应用程序调用一个IO函数,导致应用程序阻塞,等待数据准备好. 如果数据没有准备好,一直等待….数据准备好了,从内核拷贝到用户空间,IO函数返 ...
- jstl if条件判断字符串代码
<c:if test="${netWorkInfo.networkType eq '快修店'}"> <input type="radio" n ...
- 【转】12 款优秀的 JavaScript MVC 框架评估
JavaScript MVC 框架有很多,不同框架适合于不同项目需求.了解各种框架的性能及优劣有利于我们更加快捷的开发.作者(Gordon L.Hempton)一直在寻求哪种MVC框架最为完美,他将目 ...