【原创】大数据基础之Logstash(5)监控
有两种方式来监控logstash:
- api
- ui(xpack)
When you run Logstash, it automatically captures runtime metrics that you can use to monitor the health and performance of your Logstash deployment.
You can use the basic monitoring APIs provided by Logstash to retrieve these metrics. These APIs are available by default without requiring any extra configuration.
Alternatively, you can configure X-Pack monitoring to send data to a monitoring cluster.
1 api
Node Info API
The node info API retrieves information about the node.
# curl http://127.0.0.1:9600/_node?pretty

{

  "host" : "server-05",

  "version" : "6.5.4",

  "http_address" : "127.0.0.1:9600",

  "id" : "d9f6ac1d-26ab-442e-9353-c0fe3f0fe8cf",

  "name" : "server-05",

  "pipelines" : {

    "main" : {

      "workers" : 8,

      "batch_size" : 125,

      "batch_delay" : 50,

      "config_reload_automatic" : false,

      "config_reload_interval" : 3000000000,

      "dead_letter_queue_enabled" : false

    }

  },

  "os" : {

    "name" : "Linux",

    "arch" : "amd64",

    "version" : "3.10.0-957.5.1.el7.x86_64",

    "available_processors" : 8

  },

  "jvm" : {

    "pid" : 23133,

    "version" : "1.8.0_141",

    "vm_version" : "1.8.0_141",

    "vm_vendor" : "Oracle Corporation",

    "vm_name" : "Java HotSpot(TM) 64-Bit Server VM",

    "start_time_in_millis" : 1553667245630,

    "mem" : {

      "heap_init_in_bytes" : 536870912,

      "heap_max_in_bytes" : 518979584,

      "non_heap_init_in_bytes" : 2555904,

      "non_heap_max_in_bytes" : 0

    },

    "gc_collectors" : [ "ParNew", "ConcurrentMarkSweep" ]

  }

}
Plugins Info API
The plugins info API gets information about all Logstash plugins that are currently installed. This API basically returns the output of running the bin/logstash-plugin list --verbose command.
# curl http://127.0.0.1:9600/_node/plugins?pretty

{

  "host" : "server-05",

  "version" : "6.5.4",

  "http_address" : "127.0.0.1:9600",

  "id" : "d9f6ac1d-26ab-442e-9353-c0fe3f0fe8cf",

  "name" : "server-05",

  "total" : 99,

  "plugins" : [ {

    "name" : "logstash-codec-cef",

    "version" : "5.0.6"

  }, {

    "name" : "logstash-codec-collectd",

    "version" : "3.0.8"

  }, {

    "name" : "logstash-codec-dots",

    "version" : "3.0.6"

  },

...
Node Stats API
The node stats API retrieves runtime stats about Logstash.
# curl http://127.0.0.1:9600/_node/stats?pretty

{

  "host" : "server-05",

  "version" : "6.5.4",

  "http_address" : "127.0.0.1:9600",

  "id" : "d9f6ac1d-26ab-442e-9353-c0fe3f0fe8cf",

  "name" : "server-05",

  "jvm" : {

    "threads" : {

      "count" : 35,

      "peak_count" : 36

    },

    "mem" : {

      "heap_used_percent" : 50,

      "heap_committed_in_bytes" : 518979584,

      "heap_max_in_bytes" : 518979584,

      "heap_used_in_bytes" : 261155016,

      "non_heap_used_in_bytes" : 178053152,

      "non_heap_committed_in_bytes" : 218259456,

      "pools" : {

        "survivor" : {

          "peak_used_in_bytes" : 17891328,

          "used_in_bytes" : 8614928,

          "peak_max_in_bytes" : 17891328,

          "max_in_bytes" : 17891328,

          "committed_in_bytes" : 17891328

        },

        "old" : {

          "peak_used_in_bytes" : 163566944,

          "used_in_bytes" : 163566944,

          "peak_max_in_bytes" : 357957632,

          "max_in_bytes" : 357957632,

          "committed_in_bytes" : 357957632

        },

        "young" : {

          "peak_used_in_bytes" : 143130624,

          "used_in_bytes" : 88973144,

          "peak_max_in_bytes" : 143130624,

          "max_in_bytes" : 143130624,

          "committed_in_bytes" : 143130624

        }

      }

    },

    "gc" : {

      "collectors" : {

        "old" : {

          "collection_time_in_millis" : 151,

          "collection_count" : 2

        },

        "young" : {

          "collection_time_in_millis" : 11958,

          "collection_count" : 1255

        }

      }

    },

    "uptime_in_millis" : 1049304126

  },

  "process" : {

    "open_file_descriptors" : 103,

    "peak_open_file_descriptors" : 104,

    "max_file_descriptors" : 4096,

    "mem" : {

      "total_virtual_in_bytes" : 5936197632

    },

    "cpu" : {

      "total_in_millis" : 7796970,

      "percent" : 0,

      "load_average" : {

        "1m" : 0.0,

        "5m" : 0.04,

        "15m" : 0.05

      }

    }

  },

  "events" : {

    "in" : 9135,

    "filtered" : 9135,

    "out" : 9135,

    "duration_in_millis" : 11314,

    "queue_push_duration_in_millis" : 0

  },

  "pipelines" : {

    "main" : {

      "events" : {

        "duration_in_millis" : 11314,

        "in" : 9135,

        "out" : 9135,

        "filtered" : 9135,

        "queue_push_duration_in_millis" : 0

      },

      "plugins" : {

        "inputs" : [ {

          "id" : "0117e36c20fc4824ffb286255d03535acb0d462b00c0294651d48e2028315a6f",

          "events" : {

            "out" : 9135,

            "queue_push_duration_in_millis" : 0

          },

          "name" : "jdbc"

        } ],

        "filters" : [ ],

        "outputs" : [ {

          "id" : "791eb5d509a6269e6cbcbf1a8a6ffbbd12aab2924fee6e35fc70f79938534e76",

          "events" : {

            "duration_in_millis" : 10136,

            "in" : 9135,

            "out" : 9135

          },

          "name" : "kafka"

        }, {

          "id" : "3b968b786147f8809c823ca797ff6b78e60f6615794fc4716a0f52bb619bffc8",

          "events" : {

            "duration_in_millis" : 185,

            "in" : 9135,

            "out" : 9135

          },

          "name" : "stdout"

        } ]

      },

      "reloads" : {

        "last_error" : null,

        "successes" : 0,

        "last_success_timestamp" : null,

        "last_failure_timestamp" : null,

        "failures" : 0

      },

      "queue" : {

        "type" : "memory"

      }

    }

  },

  "reloads" : {

    "successes" : 0,

    "failures" : 0

  },

  "os" : {

    "cgroup" : {

      "cpuacct" : {

        "usage_nanos" : 58556486084501,

        "control_group" : "/system.slice/sshd.service"

      },

      "cpu" : {

        "cfs_quota_micros" : -1,

        "control_group" : "/system.slice/sshd.service",

        "stat" : {

          "number_of_times_throttled" : 0,

          "time_throttled_nanos" : 0,

          "number_of_elapsed_periods" : 0

        },

        "cfs_period_micros" : 100000

      }

    }

  }

}
Hot Threads API
The hot threads API gets the current hot threads for Logstash. A hot thread is a Java thread that has high CPU usage and executes for a longer than normal period of time.
# curl http://127.0.0.1:9600/_node/hot_threads?pretty

{

  "host" : "server-05",

  "version" : "6.5.4",

  "http_address" : "127.0.0.1:9600",

  "id" : "d9f6ac1d-26ab-442e-9353-c0fe3f0fe8cf",

  "name" : "server-05",

  "hot_threads" : {

    "time" : "2019-04-08T17:42:53+08:00",

    "busiest_threads" : 3,

    "threads" : [ {

      "name" : "Ruby-0-Thread-10",

      "thread_id" : 32,

      "percent_of_cpu_time" : 0.05,

      "state" : "timed_waiting",

      "path" : ":1",

      "traces" : [ "sun.misc.Unsafe.park(Native Method)", "java.util.concurrent.locks.LockSupport.parkNanos(LockSupport.java:215)", "java.util.concurrent.locks.AbstractQueuedSynchronizer$ConditionObject.awaitNanos(AbstractQueuedSynchronizer.java:2078)" ]

    }, {

      "name" : "Ruby-0-Thread-11",

      "thread_id" : 33,

      "percent_of_cpu_time" : 0.05,

      "state" : "timed_waiting",

      "path" : ":1",

      "traces" : [ "sun.misc.Unsafe.park(Native Method)", "java.util.concurrent.locks.LockSupport.parkNanos(LockSupport.java:215)", "java.util.concurrent.locks.AbstractQueuedSynchronizer$ConditionObject.awaitNanos(AbstractQueuedSynchronizer.java:2078)" ]

    }, {

      "name" : "Ruby-0-Thread-6",

      "thread_id" : 28,

      "percent_of_cpu_time" : 0.05,

      "state" : "timed_waiting",

      "path" : ":1",

      "traces" : [ "sun.misc.Unsafe.park(Native Method)", "java.util.concurrent.locks.LockSupport.parkNanos(LockSupport.java:215)", "java.util.concurrent.locks.AbstractQueuedSynchronizer$ConditionObject.awaitNanos(AbstractQueuedSynchronizer.java:2078)" ]

    } ]

  }

}
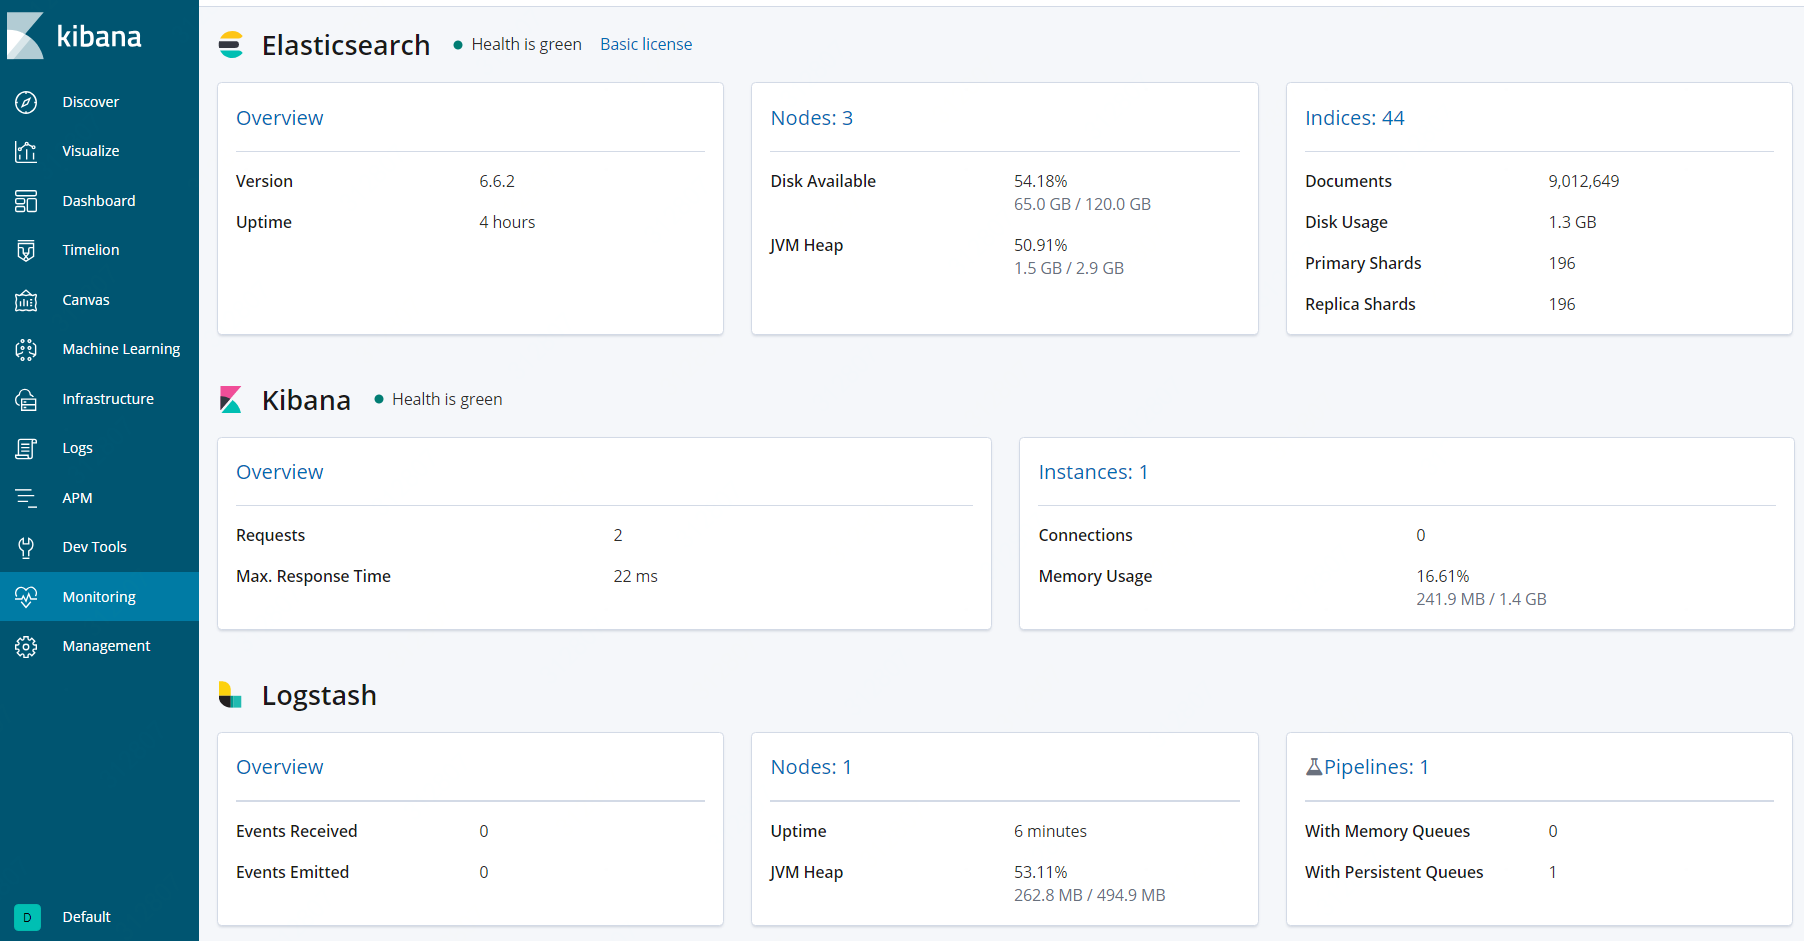
2 ui(xpack)
You can use the monitoring UI in X-Pack to view the metrics and gain insight into how your Logstash deployment is running.
Monitoring is an X-Pack feature under the Basic License and is therefore free to use.
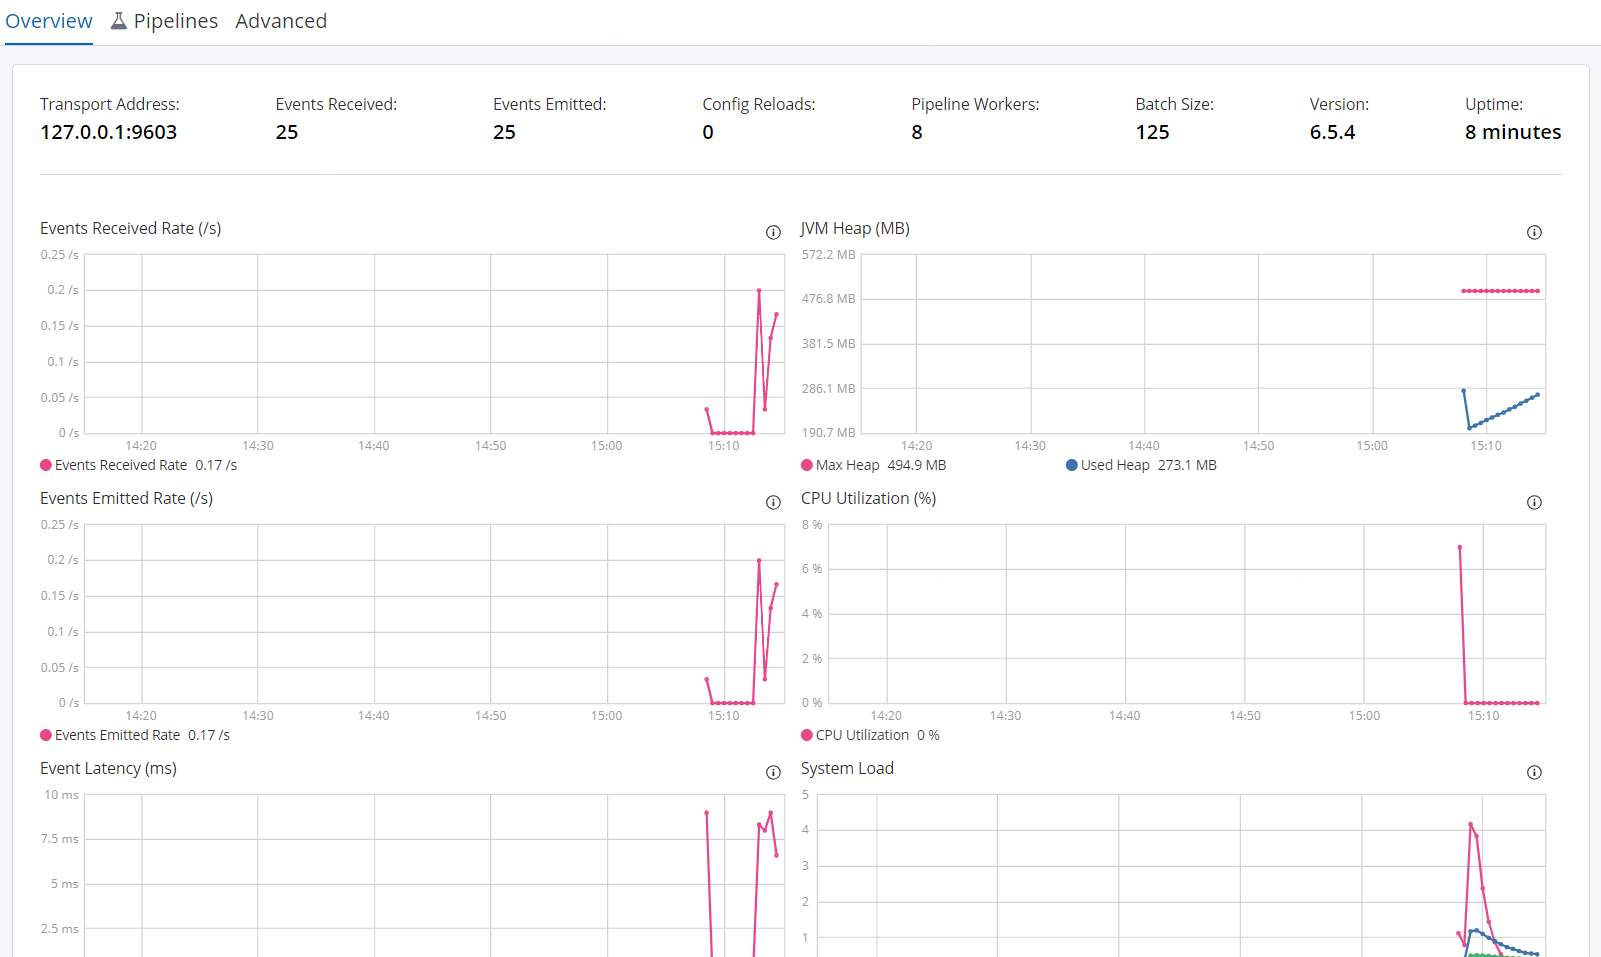
The pipeline viewer in X-Pack offers additional visibility into the behavior and performance of complex pipeline configurations. It shows a graph representation of the overall pipeline topology, data flow, and branching logic, overlaid with important metrics, like events per second, for each plugin in the view.
配置
1)logstash
xpack.monitoring.enabled: true
xpack.monitoring.elasticsearch.hosts: ["http://es-prod-node-1:9200", "http://es-prod-node-2:9200"]
开启security或ssl会有更多配置
2)elasticsearch
xpack.monitoring.enabled: true
xpack.monitoring.collection.enabled: true
3)kibana
xpack.monitoring.enabled: true
Unlike X-Pack monitoring for Elasticsearch and Kibana, there is no xpack.monitoring.collection.enabled setting on Logstash. You must use the xpack.monitoring.enabled setting to enable and disable data collection.
kibana
A Logstash node is considered unique based on its persistent UUID, which is written to the path.data directory when the node starts.
参考:
https://www.elastic.co/guide/en/logstash/current/monitoring-logstash.html
https://www.elastic.co/guide/en/logstash/current/monitoring.html
https://www.elastic.co/guide/en/logstash/current/configuring-logstash.html
https://www.elastic.co/guide/en/logstash/current/logstash-monitoring-ui.html
https://www.elastic.co/guide/en/elasticsearch/reference/current/monitoring-settings.html
https://www.elastic.co/guide/en/kibana/current/monitoring-settings-kb.html
【原创】大数据基础之Logstash(5)监控的更多相关文章
- 【原创】大数据基础之Logstash(4)高可用
logstash高可用体现为不丢数据(前提为服务器短时间内不可用后可恢复比如重启服务器或重启进程),具体有两个方面: 进程重启(服务器重启) 事件消息处理失败 在logstash中对应的解决方案为: ...
- 【原创】大数据基础之Logstash(1)简介、安装、使用
Logstash 6.6.2 官方:https://www.elastic.co/products/logstash 一 简介 Centralize, Transform & Stash Yo ...
- 【原创】大数据基础之Logstash(3)应用之http(in和out)
一个logstash很容易通过http打断成两个logstash实现跨服务器或者跨平台间数据同步,比如原来的流程是 logstash: nginx log -> kafka 打断成两个是 log ...
- 【原创】大数据基础之Logstash(2)应用之mysql-kafka
应用一:mysql数据增量同步到kafka 1 准备mysql测试表 mysql> create table test_sync(id int not null auto_increment, ...
- 【原创】大数据基础之Logstash(3)应用之file解析(grok/ruby/kv)
从nginx日志中进行url解析 /v1/test?param2=v2¶m3=v3&time=2019-03-18%2017%3A34%3A14->{'param1':' ...
- 【原创】大数据基础之Logstash(6)mongo input
logstash input插件之mongodb是第三方的,配置如下: input { mongodb { uri => 'mongodb://mongo_server:27017/db' pl ...
- 【原创】大数据基础之Zookeeper(2)源代码解析
核心枚举 public enum ServerState { LOOKING, FOLLOWING, LEADING, OBSERVING; } zookeeper服务器状态:刚启动LOOKING,f ...
- 【原创】大数据基础之词频统计Word Count
对文件进行词频统计,是一个大数据领域的hello word级别的应用,来看下实现有多简单: 1 Linux单机处理 egrep -o "\b[[:alpha:]]+\b" test ...
- 【原创】大数据基础之Impala(1)简介、安装、使用
impala2.12 官方:http://impala.apache.org/ 一 简介 Apache Impala is the open source, native analytic datab ...
随机推荐
- CodeForces Round #554 Div.2
A. Neko Finds Grapes 代码: #include <bits/stdc++.h> using namespace std; ; int N, M; int a[maxn] ...
- ABP实践(2)-ASP.NET Core 2.x版本EntityFrameworkCore(EF)使用mysql数据库
上一篇中EntityFrameworkCore默认使用的是微软的sql server,本篇改为mysql步骤如下: 1,在基础层xxx.EntityFrameworkCore依赖项添加Pomelo.E ...
- NodeJs之word文件生成与解析
NodeJs之word文件生成与解析 一,介绍与需求 1.1,介绍 1,officegen模块可以为Microsoft Office 2007及更高版本生成Office Open XML文件.此模块不 ...
- telnet-server、telnet
1.查询yum仓库中的安装包 [root@localhost /]# yum list |grep telnettelnet.x86_64 1 ...
- Spring Mybatis多数据源配置范例
<?xml version="1.0" encoding="UTF-8"?> <beans xmlns="http://www.sp ...
- ajax存在跨域问题,为什么浏览器不允许js跨域请求?
举个例子,马蓉平时去某个酒店开房,酒店有在线的管理系统,该管理系统地址叫 xxoo.hotels.com 然后她正常登录该酒店管理系统欣赏着自己跟宋喆开房的记录,这一切都很正常,然后xxoo.hote ...
- 「洛谷3338」「ZJOI2014」力【FFT】
题目链接 [BZOJ] [洛谷] 题解 首先我们需要对这个式子进行化简,否则对着这么大一坨东西只能暴力... \[F_i=\sum_{j<i} \frac{q_iq_j}{(i-j)^2}-\s ...
- va_start
#include <stdarg.h> void va_start(va_list ap, last); type va_arg(va_list ap, type); void va_en ...
- 内核空间内存申请函数kmalloc kzalloc vmalloc的区别
我们都知道在用户空间动态申请内存用的函数是 malloc(),这个函数在各种操作系统上的使用是一致的,对应的用户空间内存释放函数是 free().注意:动态申请的内存使用完后必须要释放,否则会造成内存 ...
- mysql8.0.15二进制安装
mysql8.0.15二进制安装 今天有幸尝试安装了社区版本的mysql8.0.15,记录下来,供以后方便使用.特此感谢知数堂的叶老师,提供了配置文件的模板. # 第一部分:系统配置 # 1.安装系统 ...