visualstu studio的 pdb调试文件
1. 该博客介绍了pdb文件的概念,作用。 将该博文复制到最后了。
https://devblogs.microsoft.com/devops/understanding-symbol-files-and-visual-studios-symbol-settings/
2. MicroSoft visual studio 2019的官方介绍:
--一般,以debug模式编译时,编译器会自动生成一份pdb文件,调式时需要用到该文件。 一般会自动生成到exe/dll所在的目录吧, vs调试时会自动到一些目录去找pdb文件,exe/dll所在的目录是一个默认的搜索路径。
https://www.cnblogs.com/itech/archive/2011/08/15/2136522.html
Understanding symbol files and Visual Studio’s symbol settings
Importer
January 5th, 2015
Symbols are a fundamental requirement for debugging and other diagnostic tools. Fortunately in most cases when you are building and launching your application in Visual Studio you don’t have to think about symbols for your code. However the odds are that at some point in time you’ll need to change how symbols load, where the debugger looks for them, or will need to load symbols for a 3rd party component (e.g. Windows or .NET libraries). Additionally because symbols are so fundamental to debugging, we continue to make tweaks to the experience so understanding the ins and outs of how Visual Studio behaves can save you hours of frustration.
In this blog post I’ll walk you through what symbols are and how to configure Visual Studio’s symbol settings (which are used by other diagnostic tools beyond the debugger such as the performance tools and IntelliTrace), the various knobs available when debugging, and how to trouble shoot issues when Visual Studio isn’t able to find the symbol files that you need.
Symbol basics
Before we delve into the details of symbol files it’s important to briefly review what symbols are and why they are important:
- What is a symbol file? For the Microsoft compilers, these are the .pdb files that are produced as part of your build.
- What is in a symbol (.pdb) file? The exact contents of symbol files will vary from language to language and based on your compiler settings, but at a very high level they are the record of how the compiler turned your source code into machine code that the processor executes.
- Why do I need symbols? Without symbols, tools are unable to correlate the instructions executing in the application to the original source code.
- When debugging, without a symbol file you are unable to set breakpoints on a specific line of code. If symbols are not loaded you will see a hollow circle with a warning symbol while in debug mode, and if you hover the mouse over it a tooltip will tell you that the breakpoint will not be hit because no symbols have been loaded.
- Depending on what you are debugging, symbols may be required to show you a complete call stack and to inspect objects using the Watch windows, or DataTips (e.g. this is true for C++).
- Note: If you are debugging a dump file that does not contain the heap, the debugger will need access to the original binary file so it can determine the correct symbol file to load. Said another way, if you are debugging a dump with no heap information, you need both the corresponding binary and symbol file on the symbol path.
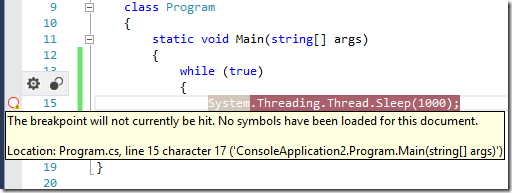
Visual Studio’s default behavior
Before we look at any of Visual Studio’s advanced settings it’s important that I stop and review the default behavior (meaning if you never touch a setting how will it behave):
- Visual Studio will try to load symbols for all binaries (referred to as “modules”) in the process when the module is loaded (and for all modules already loaded when attaching to a process).
- The exception to this is when you are debugging managed (.NET) applications, the debugger will not load symbols for any binaries considered “not your code” when “Just My Code” is enabled.
- No symbol locations are set, so it will not find symbols for any Microsoft runtime binaries
- If you right click on a module in the Call Stack or Modules windows and choose to load symbols it will automatically try to get them from the Microsoft public symbol servers assuming it can’t be found on your local machine.
- Visual Studio will always find symbols when:
- The symbol file is located in the same folder as its corresponding module. The default build output settings for Visual Studio projects will output the symbols next to the binaries. This means that Visual Studio will always be able to find the symbols for your projects.
- The symbol file is located in the same directory is was placed during compilation. The full path of the .pdb is placed into the binary at build time.
How can I tell if a symbol is loaded and if not why?
The screenshot above (with the hollow breakpoint) shows a situation where symbols didn’t load for a source file you are trying to set a breakpoint in. The other ways to determine if symbols are loaded:
- A message will appear in the call stack window saying that symbols are not loaded
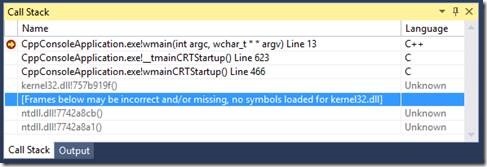
- The Modules window will tell you (Debug -> Windows -> Modules):
- The status of the symbol file (loaded, skipped, or couldn’t be opened or found)
- Path the binary is loaded from
- [if loaded] where the symbol file was loaded from
- The module version
- The module’s time stamp

Additionally the debugger can tell you why it didn’t load symbols and where it searched for them. To see this information, open the Modules window, right click on a module and choose “Symbol Load Information…”
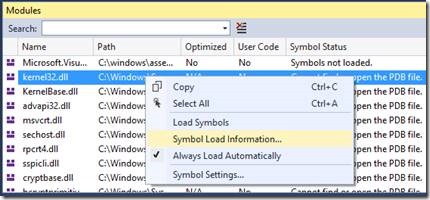
This will display a box that shows you all the paths the debugger searched for the symbol file.
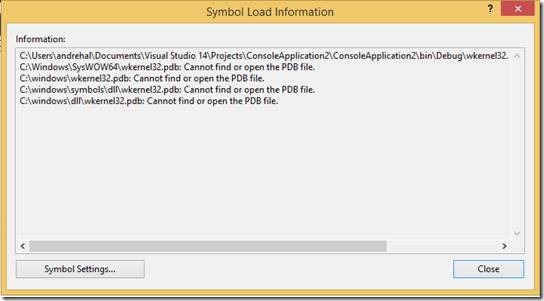
Some common reasons symbols aren’t loaded include:
- Symbol paths don’t point to the correct location
- The symbol file is from a different version of the module than the one loaded in the process
- Visual Studio requires that the symbol file come from the exact same build as the module. It cannot load symbols that come from a different build even if the source code was identical
- [Managed only] Just My Code settings prevent the debugger from loading the symbol file
Configuring Visual Studio’s settings
Now that you understand what symbols are, and how to determine if they are loaded let’s look at how you configure Visual Studio’s symbol settings. To access symbols settings, go to the “Debug” menu and choose “Options…” (“Options and Settings…” in previous versions of Visual Studio), and then select the “Symbols” sub page
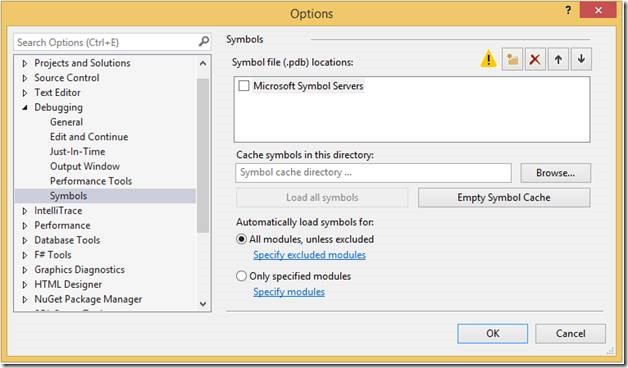
You’ll notice the following settings on the page:
- Symbol file (.pdb) locations
- Symbol cache settings
- “Load all symbols” button
Autom
- Automatic symbol loading settings
Symbol file locations
If you are building and debugging your application from Visual Studio this option likely won’t apply to the symbols for your modules, but remote symbol locations (or symbol servers) are used to load symbols in situations where you need a 3rd party symbol file (e.g. one from Microsoft), or you are working in an environment where you may not have the symbols on your local machine (e.g. your application is built using a build server. If you are using TFS read about how to add symbol and source archiving support).
The symbol file location box tells the debugger where to look for symbol files, these can be http symbol servers (e.g. the prepopulated “Microsoft Symbol Severs” entry), network shares, or folders on your local machine
- You can add as many paths as you need.
- There is a pre-populated entry for Microsoft’s public symbol servers. If you want to load symbols for modules from Microsoft (e.g. for the runtime or operating system) check this box.
- Visual Studio will search local paths before querying network paths regardless of the order provided.
- For performance reasons, beginning in Visual Studio 2012 Update 1, Visual Studio will only search each symbol server once for a symbol file in a given Visual Studio session (until you restart Visual Studio) when automatic symbol loading is enabled. This means you don’t pay the cost of a network call every time you start debugging when the server doesn’t contain the file.
- Environment Variable: _NT_SYMBOL_PATH: If you see this in your symbol file locations it means that the environment variable _NT_SYMBOL_PATH is set. Visual Studio uses a library from Windows to load symbols, and the library will always search any locations in this environment variable for symbols; which is why you cannot uncheck the option in Visual Studio. You will need to unset the environment variable if you want Visual Studio to ignore the variable.
If you need the environment variable for other purposes,
the easy way to unset the variable locally is to open a command prompt,
enter “set _NT_SYMBOL_PATH=” and then launch Visual Studio from the
command prompt. You system’s environment settings will remain
unaffected.
Symbol cache
The symbol cache is the
location on your local machine that Visual Studio places a copy of the
symbols it finds on remote locations for future use. Assuming you
provide a path for the symbol cache, Visual Studio will search the cache
before trying to find symbols in any symbol file locations you
specified above. For performance reasons we recommend specifying a
symbol cache if you need symbols stored in a remote location.
Load All Symbols
This
button is only enabled while Visual Studio is in debug mode, and
clicking it will tell the debugger to try to load symbols for all
modules in the process.
Automatic Symbol Loading
Visual Studio offers two modes of automatic symbol loading:
- Automatically load symbols for all modules unless excluded: As
the title indicates, unless you add a module to the exclude list by
clicking “Specify excluded modules”, Visual Studio will try to load
symbols for all modules in the process. You will typically want this
setting if you want symbols loaded for almost everything in the process,
or if there are only a handful of very large ones you don’t want loaded
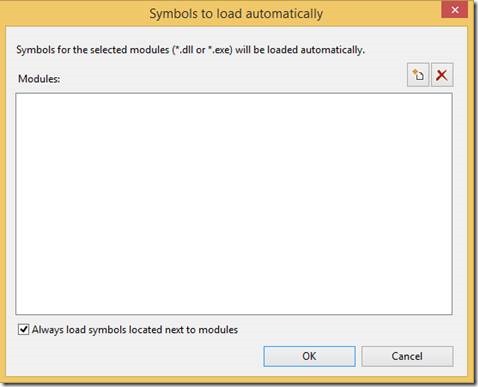
for memory or debug startup performance reasons. - Only specified modules: This
setting by default will load symbols that are next to the binary on the
disk, but will not try to load symbols for any other modules unless you
add them to the include list by clicking “Specify modules”. - beginning
with Visual Studio 2013 Update 2, the “Specify modules” dialogs accept *
for module names. So if for example you wanted to use manual loading
but always load symbols for anything with “Microsoft” in the name, you
could enter “*Microsoft*”
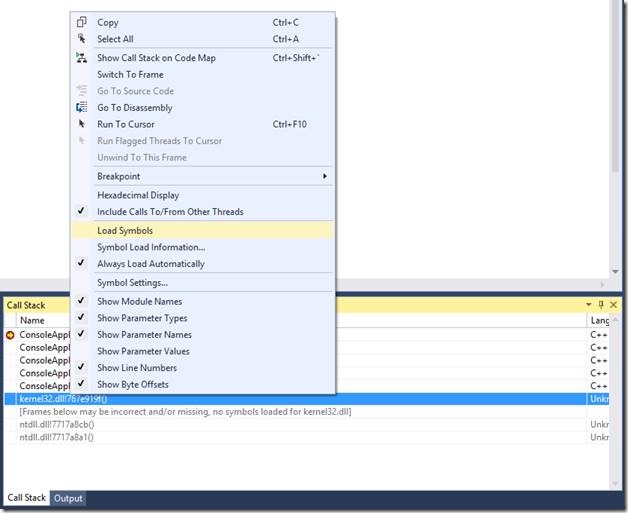
- Symbols
can be manually loaded from the Call Stack window as needed. To do
this, you can select an individual frame (or select all with ctrl+a),
right click and choose “Load symbols”. This will load symbols for all of
the modules that were in the call stack window at that time. If loading
symbols improves the call stack and additional modules are found you
will need to repeat this as it won’t automatically try to load symbols
for modules that appear due to the previous load.
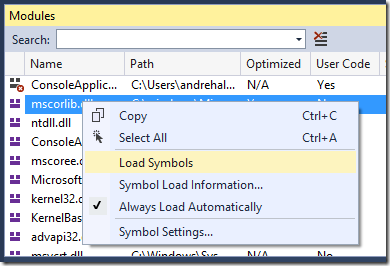
- The
other option to load symbols manually when you are debugging is to
locate the module in the Modules window (Debug -> Windows ->
Modules), right click and choose “Load Symbols”.
Deep dive on manual symbol loading
It
is worth calling out that “Only specified modules” is my and many of
the Visual Studio team’s preferred setting when debugging. The reason
for this is:
- When debugging very large applications you can load symbols on demand as you need them. This helps with:
- The
performance of your debug session—you don’t have to wait for symbols to
load for everything in the process you are debugging. - Visual
Studio’s memory—if you are debugging a very large application you may
need to selectively load symbols for only the modules you are interested
in. Since Visual Studio is a 32bit process, it can at most grow to 4 GB
in Virtual Memory. For very large applications you can have more in
symbol files than this. - You can leave your symbol servers
enabled without encountering unexpected performance hits when debugging
new applications or during your first debug session in a new Visual
Studio instance.
If you have a very large solution that you
build entirely on your machine you will need to uncheck the “Always load
symbols located next to modules” checkbox to see the benefits I
mentioned above. Then you will either need load the symbols on demand
while debugging, or set the ones you need to automatically load.
- If you need to hit breakpoints in those modules you will want to set them to load automatically.
- If
you aren’t sure you will need the symbols ahead of time you will want
to wait and load them only if you need them to inspect an object or
complete the call stack.
Conclusion
Keeping track of
symbols and configuring your settings correctly and for optimal
performance can be quite complicated. Hopefully the above content helps
you understand the settings available to you. However if you run into
issues I did not cover, or have any other feedback you’d like to share,
please let me know below, through Visual Studio’s Send a Smile feature, or in our MSDN forum.
visualstu studio的 pdb调试文件的更多相关文章
- 03. 将pdb调试文件包含到.vsix包中
vs插件如何把pdb文件打包进去,方便记录日志和调试 <PropertyGroup> <CopyLocalLockFileAssemblies>true</CopyLoc ...
- 在 Visual Studio 调试器中指定符号 (.pdb) 和源文件
查找并指定符号文件和源文件:指定符号加载行为.使用符号和源服务器上:加载符号自动或在要求. 内容 查找符号 (.pdb) 文件 查找源文件 查找符号 (.pdb) 文件 说明 在之前的 Vis ...
- 让Visual Studio载入Symbol(pdb)文件
让Visual Studio载入Symbol(pdb)文件 让Visual Studio载入Symbol(pdb)文件 在VC编译工程的编译连接阶段,会产生Symbol文件,也就是常说的 pdb 文件 ...
- win10 下visual studio 2015 在调试模式下不能跟踪源文件
win10 下visual studio 2015 在调试模式下不能跟踪源文件,只要一调试就会关闭(隐藏)打开的文档,非常不方便.经过一番折腾,发现是配置的问题. 如果安装多个版本的VS,请删除对应版 ...
- 使用zend studio配置Xdebug调试PHP教程
这里看过上面的文章后写一下自己的想法. 最近安装了zend studio 10.5,下载了破解文件.开始是下载了10.0的版本,但是注册码不正确.所以只能安装最新的10.5了. 接下来进行PHP代码调 ...
- 10个Visual Studio原生开发调试技巧
10个Visual Studio原生开发调试技巧(1) 2013-05-29 13:30 佚名 开源中国 我要评论(1) 字号:T | T 以下的列表中你可以看到写原生开发的调试技巧(接着以前的文章来 ...
- 关于Visual Studio中的TraceDebugging文件夹
最近一段时间发现C盘莫名其妙的变小了,各种清理各种卸载还是没用,电脑慢的是在无法使用 .最后只能一个文件夹一个文件夹的找,最后针对“C:\Documents and Settings\All User ...
- Mac上使用Visual Studio Code开发/调试.NET Core代码
Mac上使用Visual Studio Code开发/调试.NET Core代码 .Net Core 1.0终于发布了,Core的一大卖点就是跨平台.这个跨平台不只是跨平台运行,而且可以跨平台开发.今 ...
- Visual Studio 使用及调试必知必会
原文:Visual Studio 使用及调试必知必会 一:C# CODING 技巧 1:TODO 然后 CTRL + W + T,打开任务列表,选中 Comments,就会显示所有待做的任务 2: ...
随机推荐
- 前端之:js
JavaScript概述 ECMAScript和JavaScript的关系 1996年11月,JavaScript的创造者--Netscape公司,决定将JavaScript提交给国际标准化组织ECM ...
- python time包中的time.time()和time.clock()的区别
在统计python代码 执行速度时要使用到time包,在查找相关函数时有time.time()和time.clock()两个函数可供选择.而两者是有区别的: cpu 的运行机制:cpu是多任务的,例如 ...
- RIP路由协议:基础设置/通信练习/兼容问题
RIP工作原理 首先路由器学习到直连网段 路由器开始运行RIP,当路由器的更新周期30秒到了的时候,会向邻居发送路由表 Metric:度量值,衡量一条路由好坏的值.发送路由表时Metric值会加1 学 ...
- eclipse springboot工程打war包方法及在Tomcat中运行的方法
一, eclipse springboot打war包 1. 配置pom.xml文件 <packaging>war</packaging> <!-- 配置servlet,打 ...
- 磁盘I/O 监控 iostat
iostat -cdxm 2 5 dm-4 如果没有这个命令,需要安装sysstat 包. Usage: iostat [ options ] [ <interval> [ <cou ...
- ObjectARX之Mac os开发
网上关于ObjectARX开发的相关介绍都基于Windows环境.Mac 环境的开发几乎没有,下面介绍Mac环境下ObjectARX的开发. AutoCAD ObjectARX开发必备条件: 1. 安 ...
- mpvue小程序加载不出图片 Failed to load local image resource /images/xx.png
解决方法: 直接写 /static/img/xx.png(一定要从 "/static" 开始,不要写成 "../../static" ,当然static里面也可 ...
- 通过DatagramSocket实现UDP编程(十三)
原文链接:https://www.cnblogs.com/hysum/p/7533149.html UDP通信: UDP协议(用户数据报协议)是无连接.不可靠.无序的. UDP协议以数据报作为数据传输 ...
- pointnet++之scannet/train.py
1.作者可能把scannet数据集分成了训练集和测试集并处理成了.pickle文件. 2.在代码运行过程中,作者从.pickle文件中读出训练集1201个场景的x.y.z坐标和测试集312个场景的x. ...
- 在centos8搭建dhcp服务
1.用这两个命令就可以安装成功 yum - y install dhcp yum -y install dhcp-server.x86_64 2.配置文件在 /etc/dhcp/dhcpd.conf ...
