气象netCDF数据可视化分析
前言
- NetCDF(network Common Data Form)网络通用数据格式是由美国大学大气研究协会(University Corporation for Atmospheric Research,UCAR)的Unidata项目科学家针对科学数据的特点开发的,是一种面向数组型并适于网络共享的数据的描述和编码标准。
对程序员来说,它和zip、jpeg、bmp文件格式类似,都是一种文件格式的标准。netcdf文件开始的目的是用于存储气象科学中的数据,现在已经成为许多数据采集软件的生成文件的格式。
特点:NetCDF文件是自描述的二进制数据格式,即自带描述属性信息。通常包含了变量、维度和属性,变量包含了维度、属性(如数据单位)信息及变量的值。维度部分记录的是每个变量的维度名及长度。属性部分包含了一些额外信息,比如文件创建者等。
- 很多工具都可以处理NetCDF文件,比如MATLAB,Python,Java,NCL,GrADS,CDO,NCO,Panoply,ArcMap等等。NetCDF文件数据下载地址
- 这里主要讲一下如何利用D3在前端处理NetCDF文件进行可视化分析。
- 核心代码如下
<script>

//--------------------------------------

// 缩放控制

function zoomed() {

  var transform = d3.event.transform;

  projection.scale(scale * transform.k);

  updatePaths(svg);

}

//--------------------------------------

function dragstarted() {

  v0 = versor.cartesian(projection.invert(d3.mouse(this)));

  r0 = projection.rotate();

  q0 = versor(r0);

}

//--------------------------------------

// 拖拽控制

function dragged(d) {

  var v1 = versor.cartesian(projection.rotate(r0).invert(d3.mouse(this))),

      q1 = versor.multiply(q0, versor.delta(v0, v1)),

      r1 = versor.rotation(q1);

  projection.rotate(r1);

  updatePaths(svg);

}

//--------------------------------------

function updatePaths(svg) {

  svg.forEach(function(e) {

     	e.selectAll('path.contours').attr("d", geoPath);

     	e.selectAll('path.graticule').attr('d', geoPath);

     	e.selectAll('path.land').attr('d', geoPath);

  });

}

//--------------------------------------

function createMap(id, values, range) {

  var svg = d3.select('body').select(id).append('svg')

    .attr('width', width)

    .attr('height', height);

  var group = svg.append("g").datum([]);

  var extent = d3.extent(values);

  // 颜色插值

  var color = d3.scaleSequential(d3.interpolatePlasma)

      //.domain(d3.extent(values));

      .domain(range);

  // console.log(d3.extent(values));

  // 生成等值线

  var contours = d3.contours()

      .thresholds(d3.range(Math.floor(extent[0]/delta)*delta, Math.ceil(extent[1]/delta)*delta, delta))

      .smooth(true)

      .size([isize, jsize]);

  // 对生成的等值线进行填色

  group

   //.attr("class", "contour-stroke")

   .selectAll("path")

   .data(contours(values).map(invert))

   .enter().append("path")

   .attr('class', 'contours')

   .attr("fill", function(d) { return color(d.value); })

   .attr("d", geoPath);

  group.append('path')

    .datum(graticule)

    .attr('class', 'graticule')

    .attr('d', geoPath);

  group.append("path")

      .datum(world)

      .attr("class", "land")

      .attr("d", geoPath);

  // zoom on svg; drag on group

  group.call(d3.drag().on('start', dragstarted)

		      .on('drag', dragged));

  svg.call(d3.zoom().on('zoom', zoomed));

  return svg;

}

//==========================================

function invert(d) {

    var shared = {};

    var p = {

        type: "Polygon",

        coordinates: d3.merge(d.coordinates.map(function(polygon) {

            return polygon.map(function(ring) {

                return ring.map(function(point) {

                    return [point[0] / isize * 360 - 180, 90 - point[1] / jsize * 180];

                }).reverse();

            });

        }))

    };

    // Record the y-intersections with the antimeridian.

    p.coordinates.forEach(function(ring) {

        ring.forEach(function(p) {

            if (p[0] === -180 || p[0] === 180) {

                shared[p[1]] |= p[0] === -180 ? 1 : 2;

            }

        });

    });

    // Offset any unshared antimeridian points to prevent their stitching.

    p.coordinates.forEach(function(ring) {

        ring.forEach(function(p) {

            if ((p[0] === -180 || p[0] === 180) && shared[p[1]] !== 3) {

                p[0] = p[0] === -180 ? -179.9995 : 179.9995;

            }

        });

    });

    p = d3.geoStitch(p);

    // If the MultiPolygon is empty, treat it as the Sphere.

    return p.coordinates.length

        ? {type: "Polygon", coordinates: p.coordinates, value: d.value}

        : {type: "Sphere", value: d.value};

}

//==========================================

function reverseVar(values) {

    values = nj.array(values).reshape(jsize,isize);

    values = values.slice([null, null, -1],null);

    values = values.flatten().tolist();

    return values;

}

//==========================================

var svg = [];

var world;

var graticule;

var width = 400,

    height = 400,

    scale = 200,

    origin = {x: 55, y: -40};

var v0, // Mouse position in Cartesian coordinates at start of drag gesture.

    r0, // Projection rotation as Euler angles at start.

    q0; // Projection rotation as versor at start.

// 正交投影

var projection = d3.geoOrthographic()

    .scale(scale)

    .translate([width/2, height/2])

    .rotate([origin.x, origin.y])

    .center([0, 0]);

// 确定投影坐标系

var geoPath = d3.geoPath()

    .projection(projection);

var min = -12;

var max = 12;

var delta = 2;

var nbLevels = Math.abs(max-min)/delta + 1;

var color = d3.scaleSequential(d3.interpolatePlasma)

    .domain([min,max]);

//==========================================

var urlpath =  "navy_winds_2.nc"

var reader;

var isize, jsize;

// 读取netCDF文件数据

var oReq = new XMLHttpRequest();

oReq.open("GET", urlpath, true);

oReq.responseType = "blob";

oReq.onload = function(oEvent) {

  var blob = oReq.response;

  reader_url = new FileReader();

  reader_url.onload = function(e) {

  //====================================================================================

    reader = new netcdfjs(this.result);

    isize = reader.dimensions[0].size;

    jsize = reader.dimensions[1].size;

    var dim0Name = reader.dimensions[0].name;

    var dim1Name = reader.dimensions[1].name;

    axis0 = reader.getDataVariable(dim0Name);

    axis1 = reader.getDataVariable(dim1Name);

    var valuesVar1 = reader.getDataVariable('UWND');

    valuesVar1 = reverseVar(valuesVar1);

    var valuesVar2 = reader.getDataVariable('VWND');

    valuesVar2 = reverseVar(valuesVar2);

    range = [-12, 12];

    d3.json("world-110m.json", function(error, worldJSON) {

      if (error) throw error;

      world = topojson.feature(worldJSON, worldJSON.objects.land);

      graticule = d3.geoGraticule();

      svg1 = createMap("#map1", valuesVar1, range);

      svg.push(svg1);

      svg2 = createMap("#map2", valuesVar2, range);

      svg.push(svg2);

		svgLegend = d3.select("#legend").append('svg')

			.attr('width', 60)

			.attr('height', 800);

		svgLegend.append("g").attr("class", "legendLinear");

		var legendLinear = d3.legendColor()

			.shapeWidth(15)

			.shapeHeight(15)

			.shapePadding(1)

			.cells(nbLevels)

			.orient('vertical')

			.ascending(true)

			.labelAlign('start')

			.scale(color);

		svgLegend.select(".legendLinear")

			.call(legendLinear);

   });

  //====================================================================================

  }

  reader_url.readAsArrayBuffer(blob);

}

oReq.send(); //start process

</script>
风场数据可视化结果图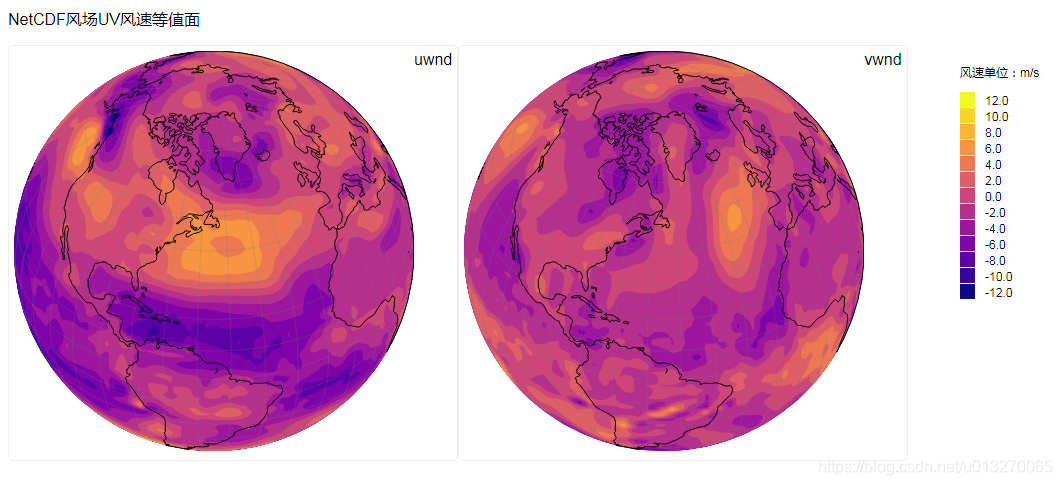
气象netCDF数据可视化分析的更多相关文章
- PLUTO平台是由美林数据技术股份有限公司下属西安交大美林数据挖掘研究中心自主研发的一款基于云计算技术架构的数据挖掘产品,产品设计严格遵循国际数据挖掘标准CRISP-DM(跨行业数据挖掘过程标准),具备完备的数据准备、模型构建、模型评估、模型管理、海量数据处理和高纬数据可视化分析能力。
http://www.meritdata.com.cn/article/90 PLUTO平台是由美林数据技术股份有限公司下属西安交大美林数据挖掘研究中心自主研发的一款基于云计算技术架构的数据挖掘产品, ...
- 爬虫综合大作业——网易云音乐爬虫 & 数据可视化分析
作业要求来自于https://edu.cnblogs.com/campus/gzcc/GZCC-16SE2/homework/3075 爬虫综合大作业 选择一个热点或者你感兴趣的主题. 选择爬取的对象 ...
- 学机器学习,不会数据分析怎么行——数据可视化分析(matplotlib)
前言 前面两篇文章介绍了 python 中两大模块 pandas 和 numpy 的一些基本使用方法,然而,仅仅会处理数据还是不够的,我们需要学会怎么分析,毫无疑问,利用图表对数据进行分析是最容易的, ...
- 基于 HTML5 WebGL 与 GIS 的智慧机场大数据可视化分析
前言:大数据,人工智能,工业物联网,5G 已经或者正在潜移默化地改变着我们的生活.在信息技术快速发展的时代,谁能抓住数据的核心,利用有效的方法对数据做数据挖掘和数据分析,从数据中发现趋势,谁就能做到精 ...
- 基于 HTML5 WebGL 与 GIS 的智慧机场大数据可视化分析【转载】
前言:大数据,人工智能,工业物联网,5G 已经或者正在潜移默化地改变着我们的生活.在信息技术快速发展的时代,谁能抓住数据的核心,利用有效的方法对数据做数据挖掘和数据分析,从数据中发现趋势,谁就能做到精 ...
- Cloudera HUE大数据可视化分析
下载版本 cdh版本 http://archive-primary.cloudera.com/cdh5/cdh/5/ 我们下载这个 这个是我下载好的 我们解压一下 下载需要的系统包 yum insta ...
- 新闻实时分析系统Hive与HBase集成进行数据分析 Cloudera HUE大数据可视化分析
1.Hue 概述及版本下载 1)概述 Hue是一个开源的Apache Hadoop UI系统,最早是由Cloudera Desktop演化而来,由Cloudera贡献给开源社区,它是基于Python ...
- 新闻网大数据实时分析可视化系统项目——13、Cloudera HUE大数据可视化分析
1.Hue 概述及版本下载 1)概述 Hue是一个开源的Apache Hadoop UI系统,最早是由Cloudera Desktop演化而来,由Cloudera贡献给开源社区,它是基于Python ...
- nmon+Java Nmon Analyser进行nmon监控数据可视化分析
我们知道nmon是一款轻量级的系统占用极少,监控功能非常强大支持跨平台ARM,centos,ubuntu等等系统的工具下载地:centos7 wget http://sourceforge.net/p ...
随机推荐
- 树莓派从烧录系统到通过wifi远程访问(新树莓派配置,无显示器、网线、键盘)
本文通过MetaWeblog自动发布,原文及更新链接:https://extendswind.top/posts/technical/raspberry_from_install_to_remote_ ...
- CTF PHP反序列化
目录 php反序列化 一.序列化 二.魔术方法 1.构造函数和析构函数 2.__sleep()和__wakeup() 3.__toString() 4.__set(), __get(), __isse ...
- mysql增删改查sql语句
未经允许,禁止转载!!!未经允许,禁止转载!!! 创建表 create table 表名删除表 drop table 表名修改表名 rename table 旧表名 to 新表名字创建数 ...
- excel矩阵运算操作-转置 行列式 相乘 逆阵
excel矩阵运算操作-转置 行列式 相乘 逆阵 https://jingyan.baidu.com/article/154b463128e13928ca8f41a4.html Excel中矩阵的相关 ...
- Android -------- BouncingJellyView 果冻视图(阻尼效果)
分享一个不错的效果,分享给大家 BouncingJellyView 果冻视图,就像果冻一样伸缩弹跳,也叫阻尼效果.这个效果在MIUI上面到处都可以看到. 效果图: 使用 项目更目录bulid.grad ...
- docker 部署jar包
docker volume create j1ls /var/lib/docker/volumes/j1/_data 上传jardocker run -it -d --name j1 -v j1:/h ...
- FFmpeg av_seek_frame规律详解
本帖最后由 TangMonk 于 2016-7-27 10:26 编辑 1 av_seek_frame对视频进行跳转规律 1.1 flags参数 #define AVSEEK_FLAG_BACKWAR ...
- ubantu使用ssh服务
Secure Shell(SSH)是一种加密网络协议,用于在不安全的网络上安全地运行网络服务.利用SSH可以实现加密并安全地远程登录计算机系统. Ubuntu安装后默认只有ssh客户端,即只能在Ubu ...
- 配置mongo.conf文件
配置mongo.conf文件,优化mongod.exe的启动 在d:/Develop/MongoDB目录下创建mongo.conf文件并写入: dbpath=d:\Develop\MongoDB\ ...
- Qt编写气体安全管理系统27-设备调试
一.前言 设备调试核心就是将整个系统中的所有打印数据统一显示到一个模块上,一般都会将硬件通信的收发数据和对应的解析信号发出来或者qdebug出来,这个在调试阶段非常有用,可以具体追踪问题出在哪,哪个数 ...