zabbix3.0.4利用iostat工具监控centos主机磁盘IO
该监控基于iostat,然后iostat 命令用来监视系统输入/输出设备负载
1.安装IOSTAT工具
# yum install sysstat -y
测试iostat 查看所有硬盘io
# iostat

Linux 2.6.-431.11..el6.ucloud.x86_64 (test8_hadoop_kaf) // _x86_64_    ( CPU)

avg-cpu: %user %nice %system %iowait %steal %idle

0.04 0.00 0.04 0.00 0.00 99.92

Device: tps Blk_read/s Blk_wrtn/s Blk_read Blk_wrtn

vda 0.10 0.23 0.92

vdb 0.00 0.00 0.15
2.部署脚本
# mkdir -p /usr/local/zabbix-agent/scripts/

# vim /usr/local/zabbix-agent/scripts/zabbix-iostat.sh
#!/bin/bash

ZBX_DEV="$1"

ZBX_METRIC="$2"

IOSTAT_LOG=/tmp/iostat.log

# Check iostat util

if ! which iostat >&>/dev/null; then

  >& echo "Can't find 'iostat' binary in \$PATH"

  >& echo "Make sure that you've installed 'sysstat' package"

  exit

fi

# Check args

[[ $# -lt  ]] && { echo "Give some more arguments, please :)"; exit ; }

# Discovering devices and spits out JSON

if [ "$ZBX_DEV" = 'discovery' ]; then

  iostat -d | \

  tail -n + |

  awk 'BEGIN {

    ORS="";

    print "{\"data\":["}

    /\d/ {printf "%s{\"%s\":\"%s\"}", separator, "{#DEVICENAME}", $, separator = ","}

    END {print "]}" }'

  exit

fi

# Test iostat log

[[ ! -f "${IOSTAT_LOG}" ]] && echo "[m|ZBX_NOTSUPPORTED] [No such file ${IOSTAT_LOG}]" && exit

# Parse iostat file

function parse_iostat() {

  grep ${ZBX_DEV} ${IOSTAT_LOG} | \

  tr ',' '.' | \

  awk -v field="$1" '

  {sum+=$field; n++;}

  END {if (n > ) print sum/n;

  else {print "[m|ZBX_NOTSUPPORTED] [Nodata.]" > "/dev/stderr"; exit };}'

}

# Exec parse funcion with number of column

case ${ZBX_METRIC} in

  rrqm/s    ) parse_iostat '';;

  wrqm/s    ) parse_iostat '';;

  r/r       ) parse_iostat '';;

  w/r       ) parse_iostat '';;

  rkb/s     ) parse_iostat '';;

  wkb/s     ) parse_iostat '';;

  avgrq-sz  ) parse_iostat '';;

  avgqu-sz  ) parse_iostat '';;

  await     ) parse_iostat '';;

  r_await   ) parse_iostat '';;

  w_await   ) parse_iostat '';;

  svctm     ) parse_iostat '';;

  util      ) parse_iostat '';;

  *         ) echo "[m|ZBX_NOTSUPPORTED] [Unsupported item key.]" && exit ;;

esac
添加脚本执行权限
# chmod +x /usr/local/zabbix-agent/scripts/zabbix-iostat.sh
# 设置参数
# echo 'UserParameter=iostat[*],/usr/local/zabbix-agent/scripts/zabbix-iostat.sh "$1" "$2"' > /etc/zabbix/zabbix_agentd.d/iostat.conf
#重启zabbix_agentd
service zabbix-agent restart
# 测试自动发现
zabbix_agentd -t iostat[discovery]
3.加入crontab
# crontab -e

* * * * * ( sleep  && iostat -dxk   > /tmp/iostat.tmp && mv /tmp/iostat.tmp /tmp/iostat.log )

* * * * * ( sleep  && iostat -dxk   > /tmp/iostat.tmp && mv /tmp/iostat.tmp /tmp/iostat.log )
# 重启计划任务
/etc/init.d/crond restart
测试监控项
# zabbix_agentd -t iostat[vda,rkb/s]
iostat[vda,rkb/s] [t|0.007]
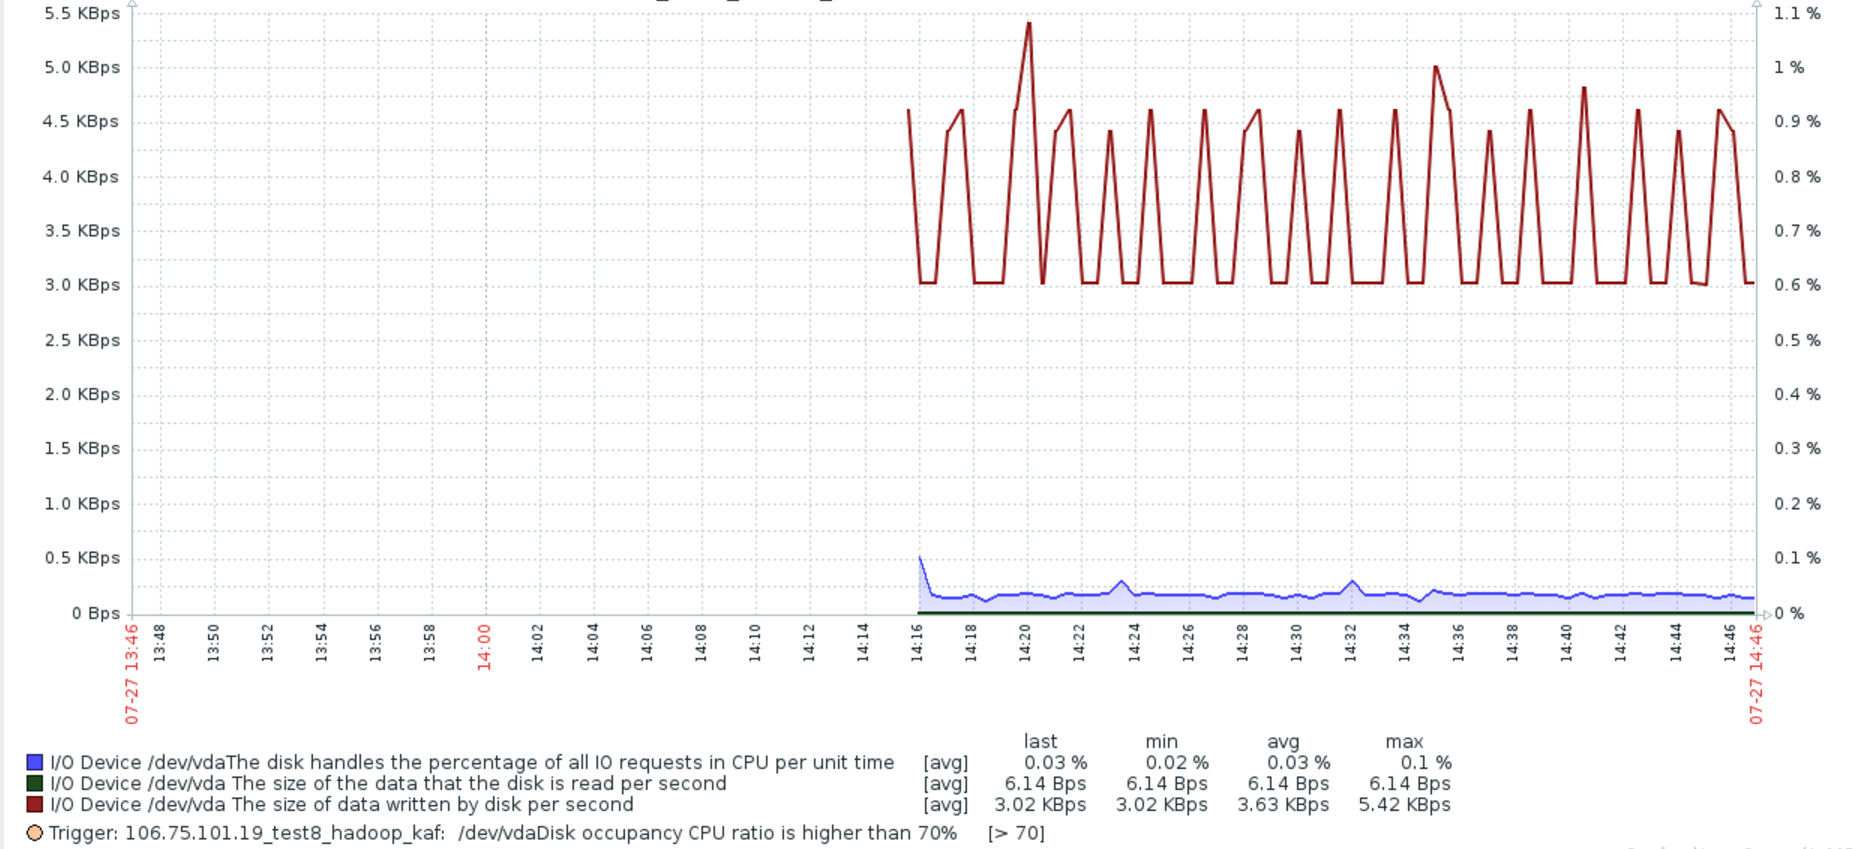
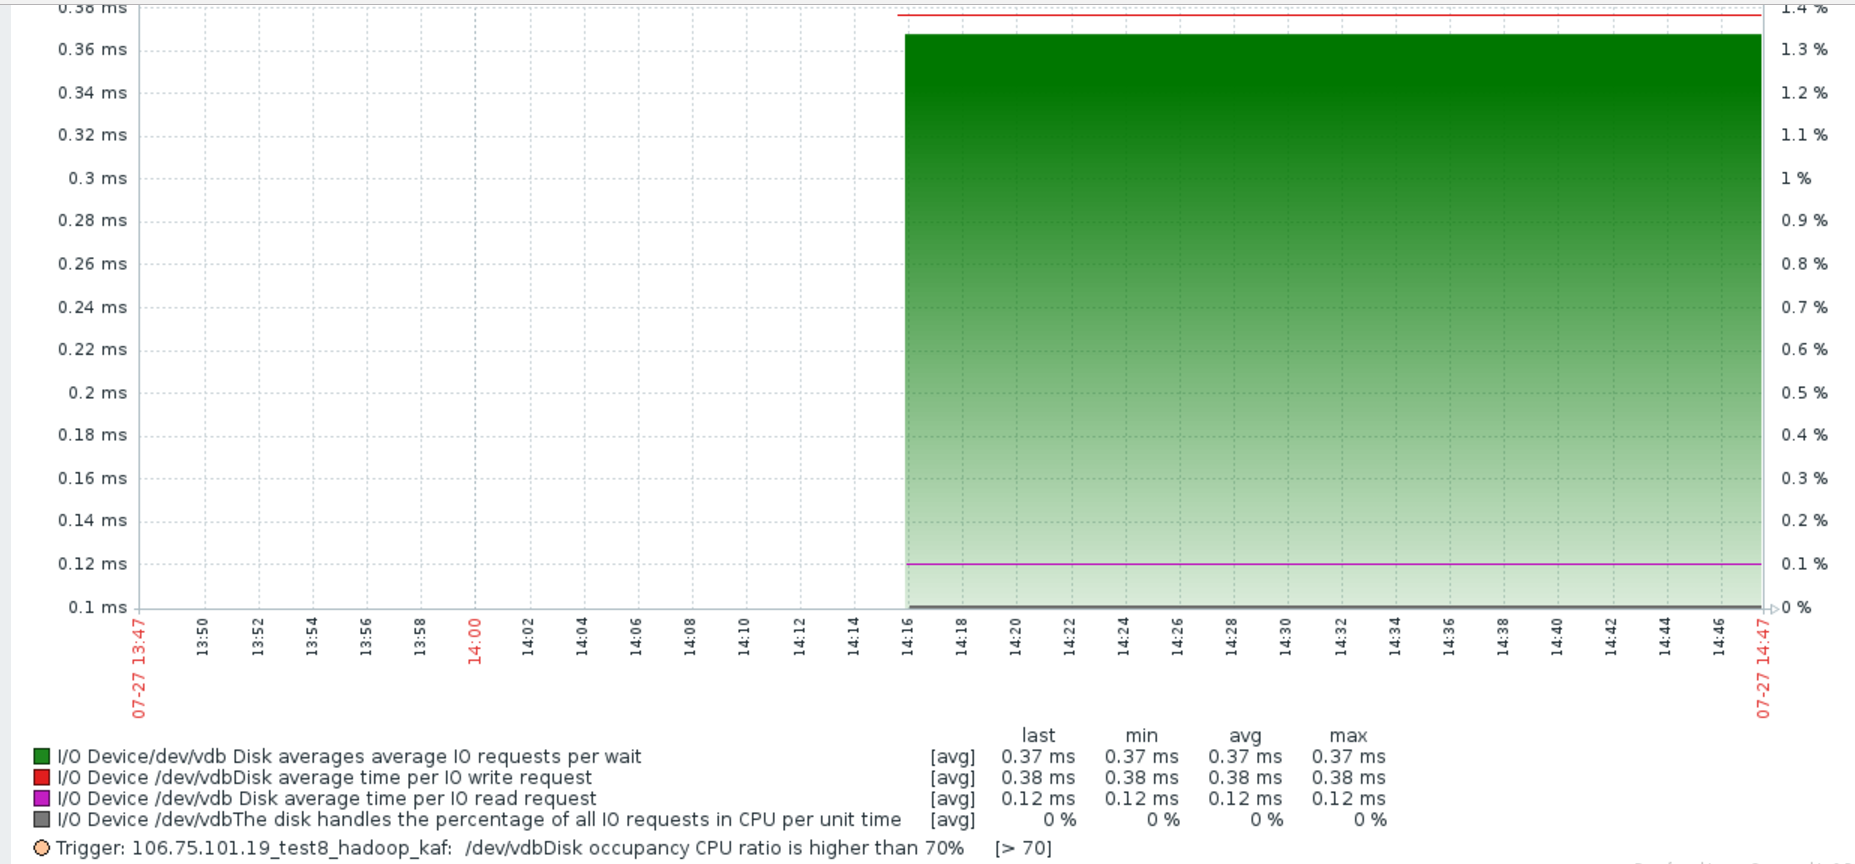
图像展示
模板:
Template_Linux_DISK_IO_Discovery_English.xml
<?xml version="1.0" encoding="UTF-8"?>
<zabbix_export>
<version>3.0</version>
<date>2017-07-27T06:45:24Z</date>
<groups>
<group>
<name>Templates</name>
</group>
</groups>
<templates>
<template>
<template>Template_Linux_DISK_IO_Discovery_English</template>
<name>Template_Linux_DISK_IO_Discovery_English</name>
<description>Low-Level Discovery disk devices and I/O Performance monitoring</description>
<groups>
<group>
<name>Templates</name>
</group>
</groups>
<applications>
<application>
<name>DISK/IO</name>
</application>
</applications>
<items/>
<discovery_rules>
<discovery_rule>
<name>Disk devices discovery</name>
<type>0</type>
<snmp_community/>
<snmp_oid/>
<key>iostat[discovery]</key>
<delay>300</delay>
<status>0</status>
<allowed_hosts/>
<snmpv3_contextname/>
<snmpv3_securityname/>
<snmpv3_securitylevel>0</snmpv3_securitylevel>
<snmpv3_authprotocol>0</snmpv3_authprotocol>
<snmpv3_authpassphrase/>
<snmpv3_privprotocol>0</snmpv3_privprotocol>
<snmpv3_privpassphrase/>
<delay_flex/>
<params/>
<ipmi_sensor/>
<authtype>0</authtype>
<username/>
<password/>
<publickey/>
<privatekey/>
<port/>
<filter>
<evaltype>0</evaltype>
<formula/>
<conditions>
<condition>
<macro>{#DEVICENAME}</macro>
<value>^(sd|hd|vd|xvd)[a-z]$</value>
<operator>8</operator>
<formulaid>A</formulaid>
</condition>
</conditions>
</filter>
<lifetime>30</lifetime>
<description>Disk devices discovery and IO Performance monitoring</description>
<item_prototypes>
<item_prototype>
<name>I/O Device /dev/$1 The average size (sector) of the disk each IO operation</name>
<type>0</type>
<snmp_community/>
<multiplier>0</multiplier>
<snmp_oid/>
<key>iostat[{#DEVICENAME},avgrq-sz]</key>
<delay>30</delay>
<history>7</history>
<trends>365</trends>
<status>0</status>
<value_type>0</value_type>
<allowed_hosts/>
<units>sectors</units>
<delta>0</delta>
<snmpv3_contextname/>
<snmpv3_securityname/>
<snmpv3_securitylevel>0</snmpv3_securitylevel>
<snmpv3_authprotocol>0</snmpv3_authprotocol>
<snmpv3_authpassphrase/>
<snmpv3_privprotocol>0</snmpv3_privprotocol>
<snmpv3_privpassphrase/>
<formula>1</formula>
<delay_flex/>
<params/>
<ipmi_sensor/>
<data_type>0</data_type>
<authtype>0</authtype>
<username/>
<password/>
<publickey/>
<privatekey/>
<port/>
<description>The average size (in sectors) of the requests that were issued to the device.
向设备发出的请求的平均大小(扇区)。</description>
<inventory_link>0</inventory_link>
<applications>
<application>
<name>DISK/IO</name>
</application>
</applications>
<valuemap/>
<logtimefmt/>
<application_prototypes/>
</item_prototype>
<item_prototype>
<name>I/O Device/dev/$1 Disk averages average IO requests per wait</name>
<type>0</type>
<snmp_community/>
<multiplier>0</multiplier>
<snmp_oid/>
<key>iostat[{#DEVICENAME},await]</key>
<delay>30</delay>
<history>7</history>
<trends>365</trends>
<status>0</status>
<value_type>0</value_type>
<allowed_hosts/>
<units>ms</units>
<delta>0</delta>
<snmpv3_contextname/>
<snmpv3_securityname/>
<snmpv3_securitylevel>0</snmpv3_securitylevel>
<snmpv3_authprotocol>0</snmpv3_authprotocol>
<snmpv3_authpassphrase/>
<snmpv3_privprotocol>0</snmpv3_privprotocol>
<snmpv3_privpassphrase/>
<formula>1</formula>
<delay_flex/>
<params/>
<ipmi_sensor/>
<data_type>0</data_type>
<authtype>0</authtype>
<username/>
<password/>
<publickey/>
<privatekey/>
<port/>
<description>await: 平均每次IO请求等待时间(包括等待时间和处理时间,毫秒为单位)</description>
<inventory_link>0</inventory_link>
<applications>
<application>
<name>DISK/IO</name>
</application>
</applications>
<valuemap/>
<logtimefmt/>
<application_prototypes/>
</item_prototype>
<item_prototype>
<name>I/O Device /dev/$1 The number of sectors that the disk successfully reads per second</name>
<type>0</type>
<snmp_community/>
<multiplier>0</multiplier>
<snmp_oid/>
<key>iostat[{#DEVICENAME},r/r]</key>
<delay>30</delay>
<history>7</history>
<trends>365</trends>
<status>0</status>
<value_type>0</value_type>
<allowed_hosts/>
<units>Rps</units>
<delta>0</delta>
<snmpv3_contextname/>
<snmpv3_securityname/>
<snmpv3_securitylevel>0</snmpv3_securitylevel>
<snmpv3_authprotocol>0</snmpv3_authprotocol>
<snmpv3_authpassphrase/>
<snmpv3_privprotocol>0</snmpv3_privprotocol>
<snmpv3_privpassphrase/>
<formula>1</formula>
<delay_flex/>
<params/>
<ipmi_sensor/>
<data_type>0</data_type>
<authtype>0</authtype>
<username/>
<password/>
<publickey/>
<privatekey/>
<port/>
<description>The number (after merges) of read requests completed per second for the device.</description>
<inventory_link>0</inventory_link>
<applications>
<application>
<name>DISK/IO</name>
</application>
</applications>
<valuemap/>
<logtimefmt/>
<application_prototypes/>
</item_prototype>
<item_prototype>
<name>I/O Device /dev/$1 The size of the data that the disk is read per second</name>
<type>0</type>
<snmp_community/>
<multiplier>1</multiplier>
<snmp_oid/>
<key>iostat[{#DEVICENAME},rkb/s]</key>
<delay>30</delay>
<history>7</history>
<trends>365</trends>
<status>0</status>
<value_type>0</value_type>
<allowed_hosts/>
<units>Bps</units>
<delta>0</delta>
<snmpv3_contextname/>
<snmpv3_securityname/>
<snmpv3_securitylevel>0</snmpv3_securitylevel>
<snmpv3_authprotocol>0</snmpv3_authprotocol>
<snmpv3_authpassphrase/>
<snmpv3_privprotocol>0</snmpv3_privprotocol>
<snmpv3_privpassphrase/>
<formula>1024</formula>
<delay_flex/>
<params/>
<ipmi_sensor/>
<data_type>0</data_type>
<authtype>0</authtype>
<username/>
<password/>
<publickey/>
<privatekey/>
<port/>
<description>The number of bytes read from the device per second
每秒从设备读取的字节数</description>
<inventory_link>0</inventory_link>
<applications>
<application>
<name>DISK/IO</name>
</application>
</applications>
<valuemap/>
<logtimefmt/>
<application_prototypes/>
</item_prototype>
<item_prototype>
<name>I/O Device /dev/$1 The number of read requests merged per second that were queued to the device</name>
<type>0</type>
<snmp_community/>
<multiplier>0</multiplier>
<snmp_oid/>
<key>iostat[{#DEVICENAME},rrqm/s]</key>
<delay>30</delay>
<history>7</history>
<trends>365</trends>
<status>0</status>
<value_type>0</value_type>
<allowed_hosts/>
<units>rrqm/s</units>
<delta>0</delta>
<snmpv3_contextname/>
<snmpv3_securityname/>
<snmpv3_securitylevel>0</snmpv3_securitylevel>
<snmpv3_authprotocol>0</snmpv3_authprotocol>
<snmpv3_authpassphrase/>
<snmpv3_privprotocol>0</snmpv3_privprotocol>
<snmpv3_privpassphrase/>
<formula>1</formula>
<delay_flex/>
<params/>
<ipmi_sensor/>
<data_type>0</data_type>
<authtype>0</authtype>
<username/>
<password/>
<publickey/>
<privatekey/>
<port/>
<description>The number of read requests merged per second that were queued to the device
每秒排队到设备上的合并请求数</description>
<inventory_link>0</inventory_link>
<applications>
<application>
<name>DISK/IO</name>
</application>
</applications>
<valuemap/>
<logtimefmt/>
<application_prototypes/>
</item_prototype>
<item_prototype>
<name>I/O Device /dev/$1 Disk average time per IO read request</name>
<type>0</type>
<snmp_community/>
<multiplier>0</multiplier>
<snmp_oid/>
<key>iostat[{#DEVICENAME},r_await]</key>
<delay>30</delay>
<history>7</history>
<trends>365</trends>
<status>0</status>
<value_type>0</value_type>
<allowed_hosts/>
<units>ms</units>
<delta>0</delta>
<snmpv3_contextname/>
<snmpv3_securityname/>
<snmpv3_securitylevel>0</snmpv3_securitylevel>
<snmpv3_authprotocol>0</snmpv3_authprotocol>
<snmpv3_authpassphrase/>
<snmpv3_privprotocol>0</snmpv3_privprotocol>
<snmpv3_privpassphrase/>
<formula>1</formula>
<delay_flex/>
<params/>
<ipmi_sensor/>
<data_type>0</data_type>
<authtype>0</authtype>
<username/>
<password/>
<publickey/>
<privatekey/>
<port/>
<description>The average time (in milliseconds) for read requests issued to the device to be served. This includes the time spent by the requests in queue and the time spent servicing them.
向设备发出的读取请求的平均时间(毫秒)。这包括队列中请求的时间和为它们服务的时间。</description>
<inventory_link>0</inventory_link>
<applications>
<application>
<name>DISK/IO</name>
</application>
</applications>
<valuemap/>
<logtimefmt/>
<application_prototypes/>
</item_prototype>
<item_prototype>
<name>I/O Device /dev/$1The disk handles the percentage of all IO requests in CPU per unit time</name>
<type>0</type>
<snmp_community/>
<multiplier>0</multiplier>
<snmp_oid/>
<key>iostat[{#DEVICENAME},util]</key>
<delay>30</delay>
<history>7</history>
<trends>365</trends>
<status>0</status>
<value_type>0</value_type>
<allowed_hosts/>
<units>%</units>
<delta>0</delta>
<snmpv3_contextname/>
<snmpv3_securityname/>
<snmpv3_securitylevel>0</snmpv3_securitylevel>
<snmpv3_authprotocol>0</snmpv3_authprotocol>
<snmpv3_authpassphrase/>
<snmpv3_privprotocol>0</snmpv3_privprotocol>
<snmpv3_privpassphrase/>
<formula>1</formula>
<delay_flex/>
<params/>
<ipmi_sensor/>
<data_type>0</data_type>
<authtype>0</authtype>
<username/>
<password/>
<publickey/>
<privatekey/>
<port/>
<description>Percentage of elapsed time during which I/O requests were issued to the device (bandwidth utilization for the device). Device saturation occurs when this value is close to 100% for devices serving requests serially. But for devices serving requests in parallel, such as RAID arrays and modern SSDs, this number does not reflect their performance limits.
对设备发出I/O请求的时间的百分比(设备带宽利用率)。设备饱和发生时,这个值是接近100%的设备服务请求连续。但在平行的服务请求的设备,如磁盘阵列和现代固态硬盘,这个数字并不反映其性能极限。</description>
<inventory_link>0</inventory_link>
<applications>
<application>
<name>DISK/IO</name>
</application>
</applications>
<valuemap/>
<logtimefmt/>
<application_prototypes/>
</item_prototype>
<item_prototype>
<name>I/O Device /dev/$1 The number of sectors per disk successfully written per second</name>
<type>0</type>
<snmp_community/>
<multiplier>0</multiplier>
<snmp_oid/>
<key>iostat[{#DEVICENAME},w/r]</key>
<delay>30</delay>
<history>7</history>
<trends>365</trends>
<status>0</status>
<value_type>0</value_type>
<allowed_hosts/>
<units>Rps</units>
<delta>0</delta>
<snmpv3_contextname/>
<snmpv3_securityname/>
<snmpv3_securitylevel>0</snmpv3_securitylevel>
<snmpv3_authprotocol>0</snmpv3_authprotocol>
<snmpv3_authpassphrase/>
<snmpv3_privprotocol>0</snmpv3_privprotocol>
<snmpv3_privpassphrase/>
<formula>1</formula>
<delay_flex/>
<params/>
<ipmi_sensor/>
<data_type>0</data_type>
<authtype>0</authtype>
<username/>
<password/>
<publickey/>
<privatekey/>
<port/>
<description>The number (after merges) of write requests completed per second for the device
每秒为设备完成的写入请求的数目(合并后)</description>
<inventory_link>0</inventory_link>
<applications>
<application>
<name>DISK/IO</name>
</application>
</applications>
<valuemap/>
<logtimefmt/>
<application_prototypes/>
</item_prototype>
<item_prototype>
<name>I/O Device /dev/$1 The size of data written by disk per second</name>
<type>0</type>
<snmp_community/>
<multiplier>1</multiplier>
<snmp_oid/>
<key>iostat[{#DEVICENAME},wkb/s]</key>
<delay>30</delay>
<history>7</history>
<trends>365</trends>
<status>0</status>
<value_type>0</value_type>
<allowed_hosts/>
<units>Bps</units>
<delta>0</delta>
<snmpv3_contextname/>
<snmpv3_securityname/>
<snmpv3_securitylevel>0</snmpv3_securitylevel>
<snmpv3_authprotocol>0</snmpv3_authprotocol>
<snmpv3_authpassphrase/>
<snmpv3_privprotocol>0</snmpv3_privprotocol>
<snmpv3_privpassphrase/>
<formula>1024</formula>
<delay_flex/>
<params/>
<ipmi_sensor/>
<data_type>0</data_type>
<authtype>0</authtype>
<username/>
<password/>
<publickey/>
<privatekey/>
<port/>
<description>The number of bytes written to the device per second.
每秒写入设备的字节数</description>
<inventory_link>0</inventory_link>
<applications>
<application>
<name>DISK/IO</name>
</application>
</applications>
<valuemap/>
<logtimefmt/>
<application_prototypes/>
</item_prototype>
<item_prototype>
<name>I/O Device /dev/$1 The number of times a disk writes per second</name>
<type>0</type>
<snmp_community/>
<multiplier>0</multiplier>
<snmp_oid/>
<key>iostat[{#DEVICENAME},wrqm/s]</key>
<delay>30</delay>
<history>7</history>
<trends>365</trends>
<status>0</status>
<value_type>0</value_type>
<allowed_hosts/>
<units>wrqm/s</units>
<delta>0</delta>
<snmpv3_contextname/>
<snmpv3_securityname/>
<snmpv3_securitylevel>0</snmpv3_securitylevel>
<snmpv3_authprotocol>0</snmpv3_authprotocol>
<snmpv3_authpassphrase/>
<snmpv3_privprotocol>0</snmpv3_privprotocol>
<snmpv3_privpassphrase/>
<formula>1</formula>
<delay_flex/>
<params/>
<ipmi_sensor/>
<data_type>0</data_type>
<authtype>0</authtype>
<username/>
<password/>
<publickey/>
<privatekey/>
<port/>
<description>The number of write requests merged per second that were queued to the device.
每秒排队到设备的写入请求数。</description>
<inventory_link>0</inventory_link>
<applications>
<application>
<name>DISK/IO</name>
</application>
</applications>
<valuemap/>
<logtimefmt/>
<application_prototypes/>
</item_prototype>
<item_prototype>
<name>I/O Device /dev/$1Disk average time per IO write request</name>
<type>0</type>
<snmp_community/>
<multiplier>0</multiplier>
<snmp_oid/>
<key>iostat[{#DEVICENAME},w_await]</key>
<delay>30</delay>
<history>7</history>
<trends>365</trends>
<status>0</status>
<value_type>0</value_type>
<allowed_hosts/>
<units>ms</units>
<delta>0</delta>
<snmpv3_contextname/>
<snmpv3_securityname/>
<snmpv3_securitylevel>0</snmpv3_securitylevel>
<snmpv3_authprotocol>0</snmpv3_authprotocol>
<snmpv3_authpassphrase/>
<snmpv3_privprotocol>0</snmpv3_privprotocol>
<snmpv3_privpassphrase/>
<formula>1</formula>
<delay_flex/>
<params/>
<ipmi_sensor/>
<data_type>0</data_type>
<authtype>0</authtype>
<username/>
<password/>
<publickey/>
<privatekey/>
<port/>
<description>The average time (in milliseconds) for write requests issued to the device to be served. This includes the time spent by the requests in queue and the time spentservicing them.
向设备发出的写入请求的平均时间(以毫秒为单位)。这包括时间,在队列中的请求和时间spentservicing他们度过。</description>
<inventory_link>0</inventory_link>
<applications>
<application>
<name>DISK/IO</name>
</application>
</applications>
<valuemap/>
<logtimefmt/>
<application_prototypes/>
</item_prototype>
</item_prototypes>
<trigger_prototypes>
<trigger_prototype>
<expression>{Template_Linux_DISK _IO _Discovery_Chinese:iostat[{#DEVICENAME},util].last(#5)}>70</expression>
<name>{HOST.NAME}: /dev/{#DEVICENAME}Disk occupancy CPU ratio is higher than 70%</name>
<url/>
<status>0</status>
<priority>3</priority>
<description>{HOST.NAME}: High I/O Utilization on /dev/{#DEVICENAME}</description>
<type>0</type>
<dependencies/>
</trigger_prototype>
</trigger_prototypes>
<graph_prototypes>
<graph_prototype>
<name>Disk I/O /dev/{#DEVICENAME} Disk read / write data size</name>
<width>1800</width>
<height>400</height>
<yaxismin>0.0000</yaxismin>
<yaxismax>100.0000</yaxismax>
<show_work_period>1</show_work_period>
<show_triggers>1</show_triggers>
<type>0</type>
<show_legend>1</show_legend>
<show_3d>0</show_3d>
<percent_left>0.0000</percent_left>
<percent_right>0.0000</percent_right>
<ymin_type_1>0</ymin_type_1>
<ymax_type_1>0</ymax_type_1>
<ymin_item_1>0</ymin_item_1>
<ymax_item_1>0</ymax_item_1>
<graph_items>
<graph_item>
<sortorder>0</sortorder>
<drawtype>5</drawtype>
<color>3333FF</color>
<yaxisside>1</yaxisside>
<calc_fnc>2</calc_fnc>
<type>0</type>
<item>
<host>Template_Linux_DISK _IO _Discovery_Chinese</host>
<key>iostat[{#DEVICENAME},util]</key>
</item>
</graph_item>
<graph_item>
<sortorder>1</sortorder>
<drawtype>2</drawtype>
<color>003300</color>
<yaxisside>0</yaxisside>
<calc_fnc>2</calc_fnc>
<type>0</type>
<item>
<host>Template_Linux_DISK _IO _Discovery_Chinese</host>
<key>iostat[{#DEVICENAME},rkb/s]</key>
</item>
</graph_item>
<graph_item>
<sortorder>2</sortorder>
<drawtype>2</drawtype>
<color>880000</color>
<yaxisside>0</yaxisside>
<calc_fnc>2</calc_fnc>
<type>0</type>
<item>
<host>Template_Linux_DISK _IO _Discovery_Chinese</host>
<key>iostat[{#DEVICENAME},wkb/s]</key>
</item>
</graph_item>
</graph_items>
</graph_prototype>
<graph_prototype>
<name>Disk I/O /dev/{#DEVICENAME} IO request time status</name>
<width>1800</width>
<height>400</height>
<yaxismin>0.0000</yaxismin>
<yaxismax>100.0000</yaxismax>
<show_work_period>1</show_work_period>
<show_triggers>1</show_triggers>
<type>0</type>
<show_legend>1</show_legend>
<show_3d>0</show_3d>
<percent_left>0.0000</percent_left>
<percent_right>0.0000</percent_right>
<ymin_type_1>0</ymin_type_1>
<ymax_type_1>0</ymax_type_1>
<ymin_item_1>0</ymin_item_1>
<ymax_item_1>0</ymax_item_1>
<graph_items>
<graph_item>
<sortorder>0</sortorder>
<drawtype>5</drawtype>
<color>007700</color>
<yaxisside>0</yaxisside>
<calc_fnc>2</calc_fnc>
<type>0</type>
<item>
<host>Template_Linux_DISK _IO _Discovery_Chinese</host>
<key>iostat[{#DEVICENAME},await]</key>
</item>
</graph_item>
<graph_item>
<sortorder>1</sortorder>
<drawtype>0</drawtype>
<color>DD0000</color>
<yaxisside>0</yaxisside>
<calc_fnc>2</calc_fnc>
<type>0</type>
<item>
<host>Template_Linux_DISK _IO _Discovery_Chinese</host>
<key>iostat[{#DEVICENAME},w_await]</key>
</item>
</graph_item>
<graph_item>
<sortorder>2</sortorder>
<drawtype>0</drawtype>
<color>BB00BB</color>
<yaxisside>0</yaxisside>
<calc_fnc>2</calc_fnc>
<type>0</type>
<item>
<host>Template_Linux_DISK _IO _Discovery_Chinese</host>
<key>iostat[{#DEVICENAME},r_await]</key>
</item>
</graph_item>
<graph_item>
<sortorder>3</sortorder>
<drawtype>2</drawtype>
<color>666666</color>
<yaxisside>1</yaxisside>
<calc_fnc>2</calc_fnc>
<type>0</type>
<item>
<host>Template_Linux_DISK _IO _Discovery_Chinese</host>
<key>iostat[{#DEVICENAME},util]</key>
</item>
</graph_item>
</graph_items>
</graph_prototype>
<graph_prototype>
<name>Disk I/O /dev/{#DEVICENAME} The number of sectors in which the disk has been successfully read / written</name>
<width>1800</width>
<height>400</height>
<yaxismin>0.0000</yaxismin>
<yaxismax>100.0000</yaxismax>
<show_work_period>1</show_work_period>
<show_triggers>1</show_triggers>
<type>0</type>
<show_legend>1</show_legend>
<show_3d>0</show_3d>
<percent_left>0.0000</percent_left>
<percent_right>0.0000</percent_right>
<ymin_type_1>0</ymin_type_1>
<ymax_type_1>0</ymax_type_1>
<ymin_item_1>0</ymin_item_1>
<ymax_item_1>0</ymax_item_1>
<graph_items>
<graph_item>
<sortorder>0</sortorder>
<drawtype>5</drawtype>
<color>3333FF</color>
<yaxisside>1</yaxisside>
<calc_fnc>2</calc_fnc>
<type>0</type>
<item>
<host>Template_Linux_DISK _IO _Discovery_Chinese</host>
<key>iostat[{#DEVICENAME},util]</key>
</item>
</graph_item>
<graph_item>
<sortorder>1</sortorder>
<drawtype>2</drawtype>
<color>009900</color>
<yaxisside>0</yaxisside>
<calc_fnc>2</calc_fnc>
<type>0</type>
<item>
<host>Template_Linux_DISK _IO _Discovery_Chinese</host>
<key>iostat[{#DEVICENAME},r/r]</key>
</item>
</graph_item>
<graph_item>
<sortorder>2</sortorder>
<drawtype>2</drawtype>
<color>880000</color>
<yaxisside>0</yaxisside>
<calc_fnc>2</calc_fnc>
<type>0</type>
<item>
<host>Template_Linux_DISK _IO _Discovery_Chinese</host>
<key>iostat[{#DEVICENAME},w/r]</key>
</item>
</graph_item>
</graph_items>
</graph_prototype>
</graph_prototypes>
<host_prototypes/>
</discovery_rule>
</discovery_rules>
<macros/>
<templates/>
<screens/>
</template>
</templates>
</zabbix_export>
zabbix3.0.4利用iostat工具监控centos主机磁盘IO的更多相关文章
- zabbix利用percona-toolkit工具监控Mysql主从同步状态
一.下载percona-toolkit工具包 percona-toolkit是一组高级命令行工具的集合,可以查看当前服务的摘要信息,磁盘检测,分析慢查询日志,查找重复索引,实现表同步等等. [root ...
- zabbix3.0.4安装grapha实现多台主机相同监控项集中展示
zabbix3.0.4安装grapha图形展示系统 操作系统 # cat /etc/redhat-release CentOS Linux release 7.2.1511 (Core) 1.安装g ...
- 【第一章】zabbix3.4监控WindowsCPU使用率磁盘IO磁盘事件日志监控阈值邮件报警详细配置
Windows安装zabbix-agent 监控Windows-CPU使用率 监控Windows-磁盘IO性能监控 监控Windows/Linux-磁盘触发器阈值更改 监控Windows-网卡自动发现 ...
- Ubuntu系统监控cpu memery 磁盘Io次数 IO速率 网卡 运行时间等信息的采集
实验室最近在做的项目要做ubuntu系统监控,要获得系统的一些信息并返回给web服务器. web服务器与ubuntu主机的通信我写的程序用的是socket,至于为什么不用java程序ssh到对应的主机 ...
- Linux系统性能测试工具(六)——磁盘io性能工具之dd
本文介绍关于Linux系统(适用于centos/ubuntu等)的磁盘io性能测试工具-dd.磁盘io性能测试工具包括: fio: dd
- Linux系统性能测试工具(五)——磁盘io性能工具之fio
本文介绍关于Linux系统(适用于centos/ubuntu等)的磁盘io性能测试工具-fio.磁盘io性能测试工具包括: fio: dd
- 利用btrace工具监控在线运行java程序
一.作用 可以用于对运行中java程序进行诊断监控分析,也可以用于开发阶段查看一些异常信息或者调用过程(如有些第三方代码没有源代码,不便于debug调试). 注:如果用于对在线运行系统的诊断,需 ...
- 利用JConsole工具监控java程序内存和JVM
一.找到java应用程序对应的进程PI 性能测试应用程序访问地址:http://192.168.29.218:7070/training/ 部署的应用服务器为tomcat6.028 启动tomcat服 ...
- (转)利用JConsole工具监控java程序内存和JVM
转自:http://www.cnblogs.com/luihengk/p/5446279.html 一.找到java应用程序对应的进程PI 性能测试应用程序访问地址:http://192.168.29 ...
随机推荐
- HDU 1038(速度里程计算 **)
题意是已知车轮的直径,圈数和时间,求所行驶的里程和速度. 单位换算,代码如下: #include <bits/stdc++.h> using namespace std; const do ...
- bash 刷题leetcode
题目一: 给定一个文本文件 file.txt,请只打印这个文件中的第十行. 示例: 假设 file.txt 有如下内容: Line 1 Line 2 Line 3 Line 4 Line 5 Line ...
- 067、如何部署Calico网络 (2019-04-10 周三)
参考https://www.cnblogs.com/CloudMan6/p/7509975.html Calico 是一个纯三层的虚拟网络方案,Calico为每个容器分配一个IP,每个host都是 ...
- STC等单片机一开机就停电模式烧写程序办法
为了测试一个低功耗程序,程序一开机就进入停机模式,结果刷不回来了,经过两个小时的试验,必须4个线同时插拔vcc,rxd,txd,gnd.如果只断开vcc是不行的.
- HTTP 响应类型 ContentType 对照表
Ø 前言 1. 下面是 HTTP 响应类型 ContentType 的可选值,有备无患先保存一下.摘自:https://wiki.selfhtml.org/wiki/MIME-Type/%C3% ...
- 1.关于Java
一.Java简介 1.java语言的特性 java语言的重要特性:跨平台: 一次编译,到处运行. 2.java的环境搭建: 1.JRE: java运行环境. JRE = java 虚拟机 + 核心类库 ...
- 随机生成10元素数组并找出最大元素(Java)
package day01; import java.util.Arrays; import java.util.Random; public class MaxOfArray { public st ...
- 二十一、Linux 进程与信号---进程资源限制
21.1 进程资源限制 在操作系统中,我们能够通过函数getrlimit().setrlimit()分别获得.设置每个进程能够创建的各种系统资源的限制使用量. 21.1.1 函数 #include & ...
- 十九、Linux 进程与信号---环境表
19.1 环境表 19.1.1 介绍 这是启动例程的第二各作用,搜集环境表,然后传递给主函数. 环境表就是一个指针数组. 环境表 每个进程都有一个独立的环境表 初始的环境表继承自父进程 主函 ...
- 基于时间的 SQL注入研究
SQL注入攻击是业界一种非常流行的攻击方式,是由rfp在1998年<Phrack>杂志第54期上的“NT Web Technology Vulnerabilities”文章中首次提出的.时 ...