Sample Means(耶鲁大学教材)
Sample Means
The sample mean  from a group of observations is an estimate of the population mean
 .
.
Given a sample of sizen, consider n independent random variables
X1,X2, ..., Xn, each corresponding to one randomly selected observation. Each of these variables has the distribution of the population, with mean
and standard deviation . The sample mean is defined to be
 .
.
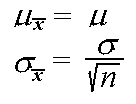
By the properties of means and variances of random variables, the mean and variance of the sample mean are the following:

Although the mean of the distribution of  is identical to the mean of the population distribution, the variance is much smaller for large sample sizes.
For example, suppose the random variable X records a randomly selected student's score on a national test, where the population distribution for the score is normal with mean 70 and standard deviation 5 (N(70,5)). Given asimple
random sample (SRS) of 200 students, the distribution of the sample mean score has mean 70 and standard deviation 5/sqrt(200) = 5/14.14 = 0.35.
Distribution of the Sample Mean
When the distribution of the population is normal, then the distribution of the sample mean is also normal. For a normal population distribution with mean and
and
standard deviation , the distribution of the sample mean is normal, with mean
and standard deviation .
.
This result follows from the fact that any linear combination of independent normal random variables is also normally distributed. This means that for two independent normal random variablesX and
Y and any constants a and b, aX + bY will be normally distributed. In the case of the sample mean, the linear combination is
=(1/n)*(X1 + X2 + ... Xn).
For example, consider the distributions of yearly average test scores on a national test in two areas of the country. In the first area, the test scoreX is normally distributed with mean 70 and standard deviation 5. In the second area, the yearly
average test scoreY is normally distributed with mean 65 and standard deviation 8. The differenceX - Y between the two areas is normally distributed, with mean 70-65 = 5 and variance 5² + 8² = 25 + 64 = 89. The standard deviation is the square
root of the variance, 9.43. The probability that areaX will have a higher score than area
Y may be calculated as follows:
P(X > Y) = P(X - Y > 0)
= P(((X - Y) - 5)/9.43 > (0 - 5)/9.43)
= P(Z > -0.53) = 1 - P(Z < -0.53) = 1 - 0.2981 = 0.7019.
Area X will have a higher average score than area Y about 70% of the time.
The Central Limit Theorem
The most important result about sample means is the Central Limit Theorem. Simply stated, this theorem says that for a large enough sample sizen, the distribution of the sample mean
 will approach a normal distribution.This is true for a sample of independent random variables from
any population distribution, as long as the population has a finite standard deviation .
.
A formal statement of the Central Limit Theorem is the following:
If  is the mean of a random sampleX1, X2, ... , Xn of size
n from a distribution with a finite mean and a finite positive variance
 ²,
²,
then the distribution ofW =  isN(0,1) in the limit as n approaches infinity.
This means that the variable  is distributedN(
 ,
, ).
).
One well-known application of this theorem is the normal approximation to the binomial distribution.
Example
Using the MINITAB "RANDOM" command with the "UNIFORM" subcommand, I generated 100 samples of size 50 each from the Uniform(0,1) distribution. The mean of this distribution is 0.5, and its standard deviation is approximately 0.3. I then applied the "RMEAN" command
to calculate the sample mean across the rows of my sample, resulting in 50 sample mean values (each of which represents the mean of 100 observations). The MINITAB "DESCRIBE" command gave the following information about the sample mean data:
Descriptive Statistics

Variable        N     Mean   Median  Tr Mean    StDev  SE Mean

C101           50  0.49478  0.49436  0.49450  0.02548  0.00360

Variable      Min      Max       Q1       Q3

C101      0.43233  0.55343  0.47443  0.51216
The mean 0.49 is nearly equal to the population mean 0.5. The desired value for the standard deviation is the population standard deviation divided by the square root of the size of the sample (which is 10 in this case), approximately 0.3/10 = 0.03. The calculated
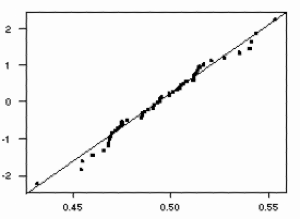
value for this sample is 0.025. To evaluate the normality of the sample mean data, I used the "NSCORES" and "PLOT" commands to create a normal quantile plot of the data, shown below.

The plot indicates that the data follow an approximately normal distribution, lying close to a diagonal line through the main body of the points.
Sample Means(耶鲁大学教材)的更多相关文章
- Joel在耶鲁大学的演讲
Joel Spolsky是一个美国的软件工程师,他的网络日志"Joel谈软件"(Joel on Software)非常有名,读者人数可以排进全世界前100名. 上个月28号,他回到 ...
- 如何获得大学教材的PDF版本?
最近急需一本算法书的配套答案,这本配套单独出售,好像在市面上还买不到,在淘宝上搜索也只是上一个版本,并没有最新版本,让我很无奈.加上平时肯定会有这么一种情况,想看一些书,但买回来也看不了几次,加上计算 ...
- 加州大学伯克利分校Stat2.3x Inference 统计推断学习笔记: Section 4 Dependent Samples
Stat2.3x Inference(统计推断)课程由加州大学伯克利分校(University of California, Berkeley)于2014年在edX平台讲授. PDF笔记下载(Acad ...
- 加州大学伯克利分校Stat2.3x Inference 统计推断学习笔记: Section 3 One-sample and two-sample tests
Stat2.3x Inference(统计推断)课程由加州大学伯克利分校(University of California, Berkeley)于2014年在edX平台讲授. PDF笔记下载(Acad ...
- 世界名校网络课程大盘点,美国大学CS专业十三大研究方向,世界50所知名大学提供开放课程
世界名校网络课程大盘点 加州大学伯克利分校http://webcast.berkeley.edu/ 加州大学伯克利分校与斯坦福大学. 麻省理工学院等一同被誉为美国工程科技界的学术 领袖,其常年位居 ...
- 美国大学排名之本科中最用功的学校top15
美国大学排名之本科中最用功的学校top15 威久留学2016-07-29 13:15:59美国留学 留学新闻 留学选校阅读(490)评论(1) 去美国留学的同学可能都知道USnews美国大学排名, ...
- 斯坦福大学Andrew Ng教授主讲的《机器学习》公开课观后感[转]
近日,在网易公开课视频网站上看完了<机器学习>课程视频,现做个学后感,也叫观后感吧. 学习时间 从2013年7月26日星期五开始,在网易公开课视频网站上,观看由斯坦福大学Andrew Ng ...
- 计算机专业-世界大学学术排名,QS排名,U.S.NEWS排名
2015年美国大学计算机专业排名 计算机专业介绍:计算机涉及的领域非常广泛,其分支学科也是非常多.所以在美国将主要的专业方向分为人工智能,程序应用,计算机系统(Systems)以及计算机理论(theo ...
- 办理卡尔加里大学(本科)学历认证『微信171922772』calgary学位证成绩单使馆认证University of calgary
办理卡尔加里大学(本科)学历认证『微信171922772』calgary学位证成绩单使馆认证University of calgary Q.微信:171922772办理教育部国外学历学位认证海外大学毕 ...
随机推荐
- Html5与Css3知识点拾遗(九)
css布局 控制元素的显示类型和可见性 块级元素 dispaly:block: 行内元素(不能设置宽度) display:inline: 不接受padding设置,但padding-top和paddi ...
- Turtle库学习笔记
一.Turtle库是Python语言中一个很流行的绘制图像的函数库,想象一个小乌龟,在一个横轴为x.纵轴为y的坐标系原点,(0,0)位置开始,它根据一组函数指令的控制,在这个平面坐标系中移动,从而在它 ...
- windows快速打开命令窗口方式[利刃篇]
windows当然是窗口界面操作了,谁有事没事去用什么命令行啊,但是当你要用的时候,也要会用才行哦. 打开命令行的方式小说一下: 1.开始 > 运行 > cmd , enter, ok ...
- Pycharm中自动生成作者,日期等信息
初次安装使用PyCharm,在新建.py文件时会发现文件头并没有什么信息,因此,使用模板会比较方便.方法如下: 1.打开PyCharm,选择File--Settings 2.依次选择Editor--- ...
- Java RMI HelloWorld
Java RMI HelloWorld RMI 远程方法调用. 顾名思义就是可以像调用本地程序方法一样调用远程(其他JVM)的程序方法. 分为3个部分: Stub:中介,代理. 封装了远程对象 ...
- Log4Net使用详解2
首先说明一点的是,log4net解决的问题是提供一个记录日志的框架,它提供了向多种目标写入的实现,比如利用log4net可以方便地将日志信息记录到文件.控制台.Windows事件日志和数据库(包括MS ...
- 以ActiveMQ为例JAVA消息中间件学习【2】
前言 之前我们学习了什么是消息中间件,以ActiveMQ为例做了一个最简单的消息中间件的实现.但是我们做的就只能算是个例子而已,因为在实际的项目中肯定会有spring插一脚,所以spring肯定有来管 ...
- 使用commit方式构建具有sshd服务的centos镜像
一般我们是通过SSH服务来管理服务器的,但是现在很多Docker镜像不带SSH服务,那我们该如何来管理这些容器呢?现在我们通常使用attach和nsenter工具.但是都无法解决远程管理容器的问题,当 ...
- ClickHouse之简单性能测试
前面的文章ClickHouse之初步认识已经简单的介绍了ClickHouse,接下来进行简单的性能测试.测试数据来源于美国民用航班的数据,从1987年到2017年,有1.7亿条. 环境: centos ...
- Debatching(Splitting) XML Message in Orchestration using DefaultPipeline - BizTalk 2010
Debatching(Splitting) XML Message in Orchestration using DefaultPipeline - BizTalk 2010 In this po ...
