测试服务器(或虚拟机)的QPS峰值
利用sysbench压测工具模拟SELECT操作
# 已有test库的话先drop掉

drop database test;

create database test;

# prepare准备阶段,构建压测环境

sysbench /usr/local/share/sysbench/tests/include/oltp_legacy/select.lua \

--oltp-table-size=20000 --mysql-table-engine=innodb --db-driver=mysql \

--mysql-user=root --mysql-password=root123 --mysql-port=3306 \

--mysql-host=10.245.231.202 --mysql-db=test \

--events=0 --time=60 --oltp-tables-count=20 --report-interval=10 --threads=2 prepare

# 开始压测

sysbench /usr/local/share/sysbench/tests/include/oltp_legacy/select.lua \

--oltp-table-size=20000 --mysql-table-engine=innodb --db-driver=mysql \

--mysql-user=root --mysql-password=root123 --mysql-port=3306 \

--mysql-host=10.245.231.202 --mysql-db=test \

--events=0 --time=60 --oltp-tables-count=20 --report-interval=10 --threads=2 run

sysbench 1.0.5 (using bundled LuaJIT 2.1.0-beta2)

Running the test with following options:

Number of threads: 2

Report intermediate results every 10 second(s)

Initializing random number generator from current time

Initializing worker threads...

Threads started!

[ 10s ] thds: 2 tps: 8087.29 qps: 8087.29 (r/w/o: 8087.29/0.00/0.00) lat (ms,95%): 0.34 err/ s: 0.00 reconn/s: 0.00

[ 20s ] thds: 2 tps: 6949.28 qps: 6949.28 (r/w/o: 6949.28/0.00/0.00) lat (ms,95%): 0.35 err/ s: 0.00 reconn/s: 0.00

[ 30s ] thds: 2 tps: 7251.71 qps: 7251.71 (r/w/o: 7251.71/0.00/0.00) lat (ms,95%): 0.34 err/ s: 0.00 reconn/s: 0.00

[ 40s ] thds: 2 tps: 6927.19 qps: 6927.19 (r/w/o: 6927.19/0.00/0.00) lat (ms,95%): 0.35 err/ s: 0.00 reconn/s: 0.00

[ 50s ] thds: 2 tps: 7387.64 qps: 7387.64 (r/w/o: 7387.64/0.00/0.00) lat (ms,95%): 0.32 err/ s: 0.00 reconn/s: 0.00

[ 60s ] thds: 2 tps: 10171.21 qps: 10171.21 (r/w/o: 10171.21/0.00/0.00) lat (ms,95%): 0.26 err/ s: 0.00 reconn/s: 0.00

SQL statistics:

    queries performed:

        read:                            467780

        write:                           0

        other:                           0

        total:                           467780

    transactions:                        467780 (7795.29 per sec.)

    queries:                             467780 (7795.29 per sec.)

    ignored errors:                      0      (0.00 per sec.)

    reconnects:                          0      (0.00 per sec.)

General statistics:

    total time:                          60.0008s

    total number of events:              467780

Latency (ms):

         min:                                  0.11

         avg:                                  0.25

         max:                                 27.63

         95th percentile:                      0.34

         sum:                             119092.82

Threads fairness:

    events (avg/stddev):           233890.0000/242.00

    execution time (avg/stddev):   59.5464/0.00
|
使用orzdba工具实际查看
[mysql@mydb1 ~]$ ./orzdba -lazy

.=================================================.

|       Welcome to use the orzdba tool !          |

|          Yep...Chinese English~                 |

'=============== Date : 2017-08-20 ==============='

HOST: mydb1   IP: 10.245.231.202

DB  : lyj|performance_schema

Var : port[3306] read_only[OFF] version[5.6.35-log]

      binlog_format[ROW] max_binlog_cache_size[4G] max_binlog_size[500M]

      max_connect_errors[100] max_connections[214] max_user_connections[2800]

      open_files_limit[1024] sync_binlog[100] table_definition_cache[600]

      table_open_cache[400] thread_cache_size[10]

      innodb_adaptive_flushing[ON] innodb_adaptive_hash_index[ON] innodb_buffer_pool_instances[8]

      innodb_buffer_pool_size[4G] innodb_file_per_table[ON] innodb_flush_log_at_trx_commit[1]

      innodb_flush_method[O_DIRECT] innodb_io_capacity[1000] innodb_lock_wait_timeout[10]

      innodb_log_buffer_size[64M] innodb_log_file_size[1000M] innodb_log_files_in_group[4]

      innodb_max_dirty_pages_pct[60] innodb_open_files[400] innodb_read_io_threads[4]

      innodb_stats_on_metadata[OFF] innodb_thread_concurrency[0] innodb_write_io_threads[10]

-------- -----load-avg---- ---cpu-usage--- ---swap---                     -QPS- -TPS-         -Hit%- ------threads------

  time  |  1m    5m   15m |usr sys idl iow|   si   so|  ins   upd   del    sel   iud|     lor    hit| run  con  cre  cac|

15:51:25| 0.07  0.04  0.05|  0   0 100   0|    0    0|    0     0     0      0     0|       0 100.00|   0    0    0    0|

15:51:28| 0.14  0.06  0.05|  8   2  90   0|    0    0|    0     0     0   7178     0|   15417 100.00|   3    4    0    0|

15:51:31| 0.13  0.06  0.05|  6   3  91   0|    0    0|    0     0     0   6757     0|   14528 100.00|   4    4    0    0|

15:51:34| 0.13  0.06  0.05|  7   2  91   0|    0    0|    0     0     0   6679     0|   14342 100.00|   4    4    0    0|

15:51:37| 0.12  0.06  0.05|  7   3  90   0|    0    0|    0     0     0   7569     0|   16285 100.00|   2    4    0    0|

15:51:40| 0.12  0.06  0.05|  8   2  90   0|    0    0|    0     0     0   7298     0|   15707 100.00|   3    4    0    0|

15:51:43| 0.19  0.07  0.06|  8   2  90   0|    0    0|    0     0     0   7668     0|   16498 100.00|   2    4    0    0|

15:51:46| 0.18  0.07  0.06|  8   2  91   0|    0    0|    0     0     0   9787     0|   21050 100.00|   2    4    0    0|

15:51:49| 0.18  0.07  0.06|  8   2  91   0|    0    0|    0     0     0  11045     0|   23759 100.00|   2    4    0    0|

15:51:52| 0.24  0.09  0.06|  8   2  90   0|    0    0|    0     0     0   9709     0|   20881 100.00|   2    4    0    0|

# 从上面可以看出QPS峰值大约在1万
|
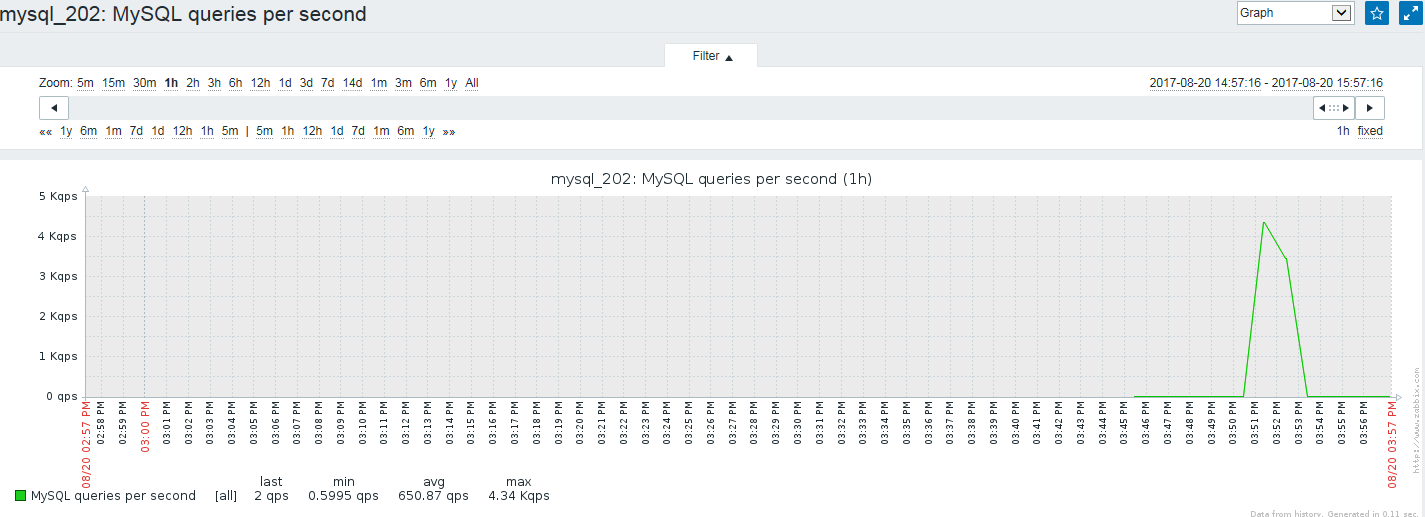
利用ZABBIX监控工具观察QPS
zabbix自带的mysql模板共可监测以下14项,图形化查看方法如下
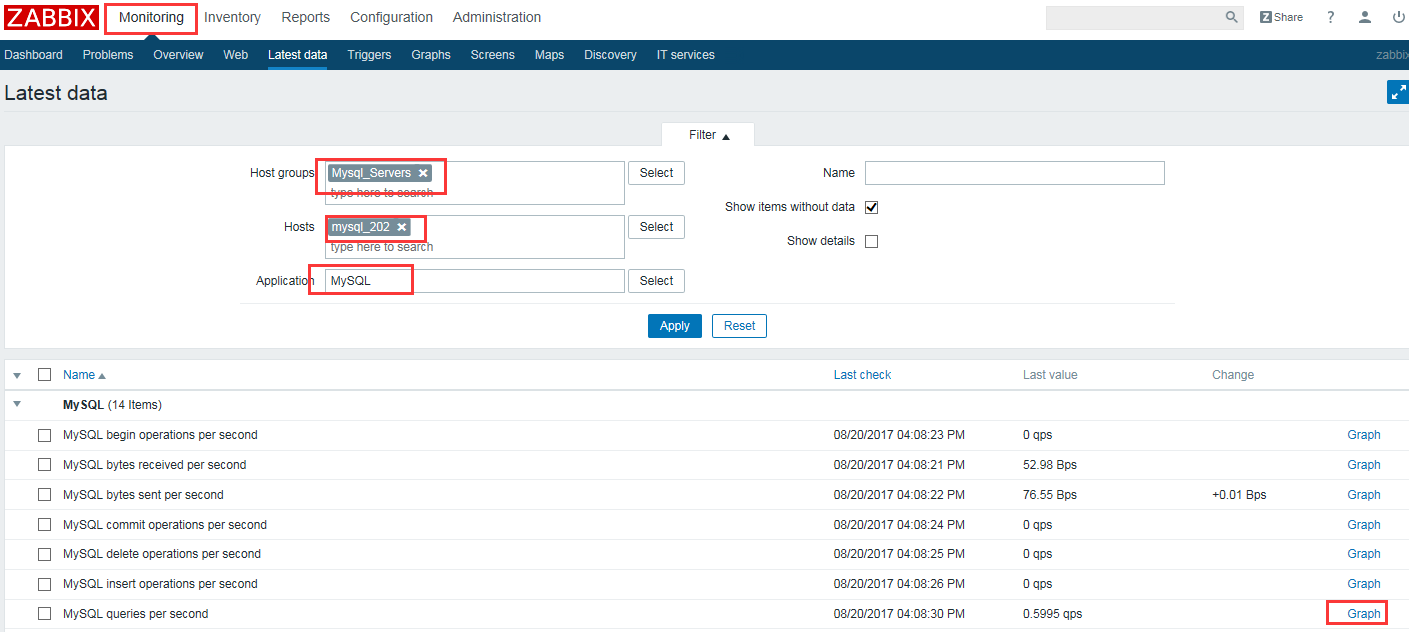
点”MySQL queries per second”项的Graph”就可以图形化观察QPS了
重现MySQL主从复制延迟的场景
查看主从库状态
比较主库的Position和从库的Read_Master_Log_Pos和Exec_Master_Log_Pos是不是相同,以下相同说明没有延迟
# 主库状态

mysql> show master status\G;

*************************** 1. row ***************************

             File: binlog.000031

         Position: 458032215

     Binlog_Do_DB:

 Binlog_Ignore_DB:

Executed_Gtid_Set:

1 row in set (0.00 sec)

# 从库状态

mysql> show slave status\G;

*************************** 1. row ***************************

               Slave_IO_State: Waiting for master to send event

                  Master_Host: 10.245.231.202

                  Master_User: rep

                  Master_Port: 3306

                Connect_Retry: 60

              Master_Log_File: binlog.000031

          Read_Master_Log_Pos: 458032215

               Relay_Log_File: relaylog.000002

                Relay_Log_Pos: 458032375

        Relay_Master_Log_File: binlog.000031

             Slave_IO_Running: Yes

            Slave_SQL_Running: Yes

              Replicate_Do_DB:

          Replicate_Ignore_DB:

           Replicate_Do_Table:

       Replicate_Ignore_Table:

      Replicate_Wild_Do_Table:

  Replicate_Wild_Ignore_Table:

                   Last_Errno: 0

                   Last_Error:

                 Skip_Counter: 0

          Exec_Master_Log_Pos: 458032215

              Relay_Log_Space: 458032541

              Until_Condition: None

               Until_Log_File:

                Until_Log_Pos: 0

           Master_SSL_Allowed: No

           Master_SSL_CA_File:

           Master_SSL_CA_Path:

              Master_SSL_Cert:

            Master_SSL_Cipher:

               Master_SSL_Key:

        Seconds_Behind_Master: 0

Master_SSL_Verify_Server_Cert: No

                Last_IO_Errno: 0

                Last_IO_Error:

               Last_SQL_Errno: 0

               Last_SQL_Error:

  Replicate_Ignore_Server_Ids:

             Master_Server_Id: 101

                  Master_UUID: 337aaf35-1b73-11e7-8b30-005056a01c3e

             Master_Info_File: /u01/data/3306/master.info

                    SQL_Delay: 0

          SQL_Remaining_Delay: NULL

      Slave_SQL_Running_State: Slave has read all relay log; waiting for the slave I/O thread to update it

           Master_Retry_Count: 86400

                  Master_Bind:

      Last_IO_Error_Timestamp:

     Last_SQL_Error_Timestamp:

               Master_SSL_Crl:

           Master_SSL_Crlpath:

           Retrieved_Gtid_Set:

            Executed_Gtid_Set:

                Auto_Position: 0

1 row in set (0.00 sec)
|
用sysbench工具做大批量的insert
# 创建数据库

mysql> drop database lyj;

mysql> create database lyj;

# 用sysbench工具准备测试环境

sysbench /usr/local/share/sysbench/tests/include/oltp_legacy/insert.lua \

--oltp-table-size=1000000 --mysql-table-engine=innodb --db-driver=mysql \

--mysql-user=root --mysql-password=root123 --mysql-port=3306 \

--mysql-host=10.245.231.202 --mysql-db=lyj \

--events=0 --time=60 --oltp-tables-count=2 --report-interval=10 --threads=2 prepare
|
查看从库状态
在insert过程中,从库的Read_Master_Log_Pos和Exec_Master_Log_Pos出现不相同现象,表明MySQL主从复制有延迟
mysql> show slave status\G;

*************************** 1. row ***************************

               Slave_IO_State: Queueing master event to the relay log

                  Master_Host: 10.245.231.202

                  Master_User: rep

                  Master_Port: 3306

                Connect_Retry: 60

              Master_Log_File: binlog.000031

          Read_Master_Log_Pos: 524289249

               Relay_Log_File: relaylog.000002

                Relay_Log_Pos: 458032683

        Relay_Master_Log_File: binlog.000031

             Slave_IO_Running: Yes

            Slave_SQL_Running: Yes

              Replicate_Do_DB:

          Replicate_Ignore_DB:

           Replicate_Do_Table:

       Replicate_Ignore_Table:

      Replicate_Wild_Do_Table:

  Replicate_Wild_Ignore_Table:

                   Last_Errno: 0

                   Last_Error:

                 Skip_Counter: 0

          Exec_Master_Log_Pos: 458032523

              Relay_Log_Space: 524289857

              Until_Condition: None

               Until_Log_File:

                Until_Log_Pos: 0

           Master_SSL_Allowed: No

           Master_SSL_CA_File:

           Master_SSL_CA_Path:

              Master_SSL_Cert:

            Master_SSL_Cipher:

               Master_SSL_Key:

        Seconds_Behind_Master: 22

Master_SSL_Verify_Server_Cert: No

                Last_IO_Errno: 0

                Last_IO_Error:

               Last_SQL_Errno: 0

               Last_SQL_Error:

  Replicate_Ignore_Server_Ids:

             Master_Server_Id: 101

                  Master_UUID: 337aaf35-1b73-11e7-8b30-005056a01c3e

             Master_Info_File: /u01/data/3306/master.info

                    SQL_Delay: 0

          SQL_Remaining_Delay: NULL

      Slave_SQL_Running_State: Reading event from the relay log

           Master_Retry_Count: 86400

                  Master_Bind:

      Last_IO_Error_Timestamp:

     Last_SQL_Error_Timestamp:

               Master_SSL_Crl:

           Master_SSL_Crlpath:

           Retrieved_Gtid_Set:

            Executed_Gtid_Set:

                Auto_Position: 0
- MySQL性能优化最佳实践 - 01 MySQL优化方法论
MySQL优化方法的关键是? MySQL参数优化,innodb_buffer_pool_size/innodb_flush_log_at_trx_commit/sync_binlog SQL开发规范 ...
- MySQL性能优化最佳实践 - 05 MySQL核心参数优化
back_log参数的作用 指定MySQL可能的TCP/IP的连接数量(一个TCP/IP连接占256k),默认是50.当MySQL主线程在很短的时间内得到非常多的连接请求,该参数就起作用,之后主线程花 ...
- 【读书笔记】读《高性能网站建设指南》及《高性能网站建设进阶指南:Web开发者性能优化最佳实践》
这两本书就一块儿搞了,大多数已经理解,简单做个标记.主要对自己不太了解的地方,做一些记录. 一.读<高性能网站建设指南> 0> 黄金性能法则:只有10%~20%的最终用户响应时间 ...
- 经典的性能优化最佳实践 web性能权威指南 读书笔记
web性能权威指南 page 203 经典的性能优化最佳实践 无论什么网络,也不管所用网络协议是什么版本,所有应用都应该致力于消除或减 少不必要的网络延迟,将需要传输的数据压缩至最少.这两条标准是经典 ...
- MySQL性能优化最佳实践20条
今天,数据库的操作越来越成为整个应用的性能瓶颈了,这点对于Web应用尤其明显.关于数据库的性能,这并不只是DBA才需要担心的事,而这更是我们程序员需要去关注的事情.当我们去设计数据库表结构,对操作数据 ...
- ASP.NET Core 性能优化最佳实践
本文提供了 ASP.NET Core 的性能最佳实践指南. 译文原文地址:https://docs.microsoft.com/en-us/aspnet/core/performance/perfor ...
- Google的网站性能优化最佳实践
网站性能最佳实践 当描述一个web页面的页面速度,评价的一致性遵循许多不同的规则.这些规则是任何阶段的web开发可以应用的前端最佳实践.这个文档的每个规则都陈述于此,无论你是否运行页面测速工具-- ...
- react性能优化最佳实践
1.PureComponent 的使用场景 PureComponent 和 Component 的区别是,PureComponent 自带 shouldComponentUpdate 生命周期函数,会 ...
- Unity3D性能优化最佳实践(四)资源审查
Asset auditing - 资源审查 许多项目发生效能问题的真正原因只是由于人员操作不当或是试东试西,而不小心改到导入设定影响到导入的资源.(例如最近的gitlab惨案) 对于较大规模的项目,最 ...
随机推荐
- java求两个圆相交坐标
最近由于项目需要,根据两个圆函数求出相交的坐标.实现代码如下,另感谢两圆求交点算法实现Java代码,虽然他所贡献的代码中存在问题,但仍有借鉴意义. 1.两个圆相交的数学求法 在中学数学中我们知道,一个 ...
- Struts 2 的常规配置
Struts 2 的默认配置文件是struts.xml,该文件应该放在Web应用的类加载路径下,通常就是放在WEB-INF/classes路径下. struts.xml文件的最大作用是配置Action ...
- C#判断两个字符串是否相等的方法 ,还有char赋空值办法。
string str1="Test"; string str2 = "Test"; if (str1==str2) //第一种判断方式 { //第二种判断方式 ...
- Linux 笔记(自用)
一,常用工具 1. 常用浏览器 w3m links lynx 都可以用 apt-get install *** 安装,访问方式都是 w3m/links/lynx www.baidu.com 的形式 2 ...
- python实现图书管理系统
# 用户注册 def logon(): print("欢迎来到图书管理系统注册页面~") username = input("请输入用户名:") if len( ...
- AUTOSAR-Specification of Watchdog Manager 阅读
一.开门狗管理有三种机制 1.定周期任务实时监控 2.非定周期任务执行时间监控 3.逻辑监控,执行顺序. 二.受监控的实体和检查点 Watchdog Manager监督软件的执行.监督的逻辑单位是受监 ...
- Thymeleaf标签学习
目录 Thymeleaf Thymeleaf的特点 SpringBoot与之整合 Thymeleaf常用语法 变量_变量案列 变量_动静结合 变量_ognl表达式的语法糖 变量_自定义变量 方法 方法 ...
- 从git上拉取项目 如果数据库密码不一致 会报错 500
解决方法 在该路径下设置 数据库的密码
- SecureCRT8.3
https://blog.csdn.net/dff1993/article/details/81189610 这篇文章我试过,成功激活了SecureCRT8.3
- yum的repo文件详解、以及epel简介、yum源的更换、常用yum命令
https://www.cnblogs.com/nineep/p/6795692.html yum的repo文件详解.以及epel简介.yum源的更换 常用命令如下: yum list ...