Linux Notes | Linux常用命令行笔记
[ show all running processes ]
(1) ps -aux | less
'ps' means: Process Status
The -a option tells ps to list the processes of all users on the system rather than just those of the current user, with the exception of group leaders and processes not associated with a terminal. A group leader is the first member of a group of related processes.
The -u option tells ps to provide detailed information about each process. The -x option adds to the list processes that have no controlling terminal, such as daemons, which are programs that are launched during booting (i.e., computer startup) and run unobtrusively in the background until they are activated by a particular event or condition.
As the list of processes can be quite long and occupy more than a single screen, the output of ps -aux can be piped (i.e., transferred) to the less command, which lets it be viewed one screenful at a time. The output can be advanced one screen forward by pressing the SPACE bar and one screen backward by pressing the b key.
(2) top
the command-line will show a process monitor. The meaning of each column is as follows:
- Process ID
- User
- Priority
- Nice level
- Virtual memory used by process
- Resident memory used by a process
- Shareable memory
- CPU used by process as a percentage
- Memory used by process as a percentage
- Time process has been running
- Command
Some options:
- -h - Show the current version
- -c - This toggles the command column between showing command and program name
- -d - Specify the delay time between refreshing the screen
- -o - Sorts by the named field
- -p - Only show processes with specified process IDs
- -u - Show only processes by the specified user
- -i - Do not show idle tasks
[ create a new env with conda ]
conda create --name {ENV_NAME} python={PYTHON_VERSION}
There are 2 variables in the command line, ENV_NAME and PYTHON_VERSION. Decide them to your needs.
[ show the usage of the Nvidia GPUs]
(1) nvidia-smi
Some useful option:
-l : Output the status frequently, default parameter is 5. You can make it show every 10 seconds by nvidia-smi -l 10.
-i : Choose to show a certain GPU by this option.
-f : redirect the output to other files.
To get more information officially, visit this doc: http://developer.download.nvidia.com/compute/DCGM/docs/nvidia-smi-367.38.pdf
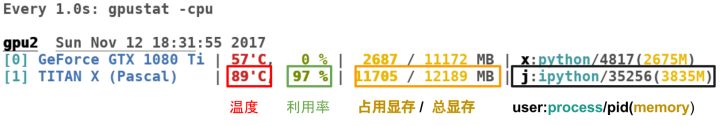
(2) gpustat
gpustat is another tool to show the status of GPU. Using with watch command is a good way to frequently show sensor data.
gpustat [options]
options:
--color: Force colored output (even when stdout is not a tty)--no-color: Suppress colored output-u,--show-user: Display username of the process owner-c,--show-cmd: Display the process name-p,--show-pid: Display PID of the process-P,--show-power: Display GPU power usage and/or limit (drawordraw,limit)--watch,-i,--interval: Run in watch mode (equivalent towatch gpustat) if given. Denotes interval between updates.
[ watch ]
a built-in command of Linux
watch [options] {COMM}
options:
-n:指定指令执行的间隔时间(秒);

-d:高亮显示指令输出信息不同之处;

-t:不显示标题。
eg. watch -n 1 -d gpustat
[ show size of directories ]
du -h --max-depth=1
-h: human understandable
--max-depth: maximam recurrent depth
[ show disk usage]
df -h
-h: human understandable
[ output the line number of a file ]
wc [options] file
wc means word count, the output without any option consists of three numbers which are the numbers of lines, words and bytes.
[ download files and install ]
wget
frequently used option: wget -O {NEW_NAME} {FILE_URL}
[ stop a process forcibly ]
kill [options]
options:
-a:当处理当前进程时,不限制命令名和进程号的对应关系;

-l <信息编号>:若不加<信息编号>选项,则-l参数会列出全部的信息名称;

-p:指定kill 命令只打印相关进程的进程号,而不发送任何信号;

-s <信息名称或编号>:指定要送出的信息;

-u:指定用户。
-s signals:
HUP     1    终端断线

INT     2    中断(同 Ctrl + C)

QUIT    3    退出(同 Ctrl + \)

TERM   15    终止

KILL    9    强制终止

CONT   18    继续(与STOP相反, fg/bg命令)

STOP   19    暂停(同 Ctrl + Z)
ps -aus to search for pid, then kill it by signal 9.
[ 进程杀死后显存占用解除 ]
sudo fuser /dev/nvidia*
查看占用nvidia显卡的进程pid
ps -aux | less
查看对应进程的状态、所有者、任务等信息,防止误杀
kill -9 pid
杀死僵尸进程
[ get the information about the hardware ]
CPU
cpu型号:cat /proc/cpuinfo | grep name | cut -f2 -d: | uniq -c
cpu个数:cat /proc/cpuinfo| grep "physical id"| sort| uniq| wc -l
cpu核心数:cat /proc/cpuinfo | grep "cpu cores"| uniq
cpu总线程数:cat /proc/cpuinfo | grep 'processor' | sort -u | wc -l
内存
内存情况:free -h
硬盘
硬盘分区情况:lsblk
lsblk -o (output column) {COLUMN_NAME}
eg. lsblk -o NAME,ROTA
输出名称和旋转式磁盘两列信息。通过这个命令,可以找SSD。
硬盘分区使用情况:df -h
硬盘容量占用情况:du -h
查看某一个文件或文件夹的大小: du -sh {DIR_NAME}
等价于 du -s -h {DIR_NAME}
-s: summarize, -h: human-readable
统计文件个数:du {DIR_NAME} 或者 du {DIR_NAME} | wc -l
网卡
网卡型号:lspci | grep -i 'eth'
显卡
显卡使用情况:nvidia-smi
[ show image file information via command-line ]
concise version: identify {FILE_NAME}
detailed version: identify -verbose {FILE_NAME}
[ 硬盘挂载 ]
重启服务器之后,原来的一块硬盘根目录路径依然存在,但是里面的数据无法访问到,这是因为这块硬盘在服务器重启之后没有挂载。
sudo mount /dev/sdb /media/data/
命令行很简单,但是要找到是哪块物理硬盘掉了,对应挂到哪个挂载点,需要经验积累。
涉及到的命令: lsblk(查看硬盘挂载情况,查看ssd),mount(挂载)。
*挂载时遇到mount: unknown filesystem type 'LVM2_member':使用逻辑卷Logic Volume的名称挂载即可。
使用 sudo lvdisplay 查看逻辑卷路径 LV path,而后使用 mount {LV_path} {MOUNT_POINT}完成挂载。
[ 创建用户、分配超级用户权限 ]
创建用户: adduser {USER_NAME},然后根据提示输入密码,之后回车选择default即可。
删除用户:先退出登录的用户,然后userdel {USER_NAME}
若需要同时删除用户目录,userdel --remove-home {USER_NAME}
给超级权限:vim /etc/sudoers
在User privilege specification中加入:{USER_NAME} ALL=(ALL:ALL) ALL即可。
[ 添加已知IP的主机名 ]
/etc/hosts 文件中记录了已知的ip及对应的主机名,在文件中的第一部分添加ip和主机名即可。
Linux Notes | Linux常用命令行笔记的更多相关文章
- Linux vi 编辑器 常用命令行
1.vi 模式 a) 一般模式: vi 处理文件时,一进入该文件,就是一般模式了. b) 编辑模式:在一般模式下可以进行删除,复制,粘贴等操作,却无法进行编辑操作.等按下'i,I,o,O,a, ...
- Linux 操作MySQL常用命令行(转)
注意:MySQL中每个命令后都要以分号:结尾. 1.显示数据库 mysql> show databases; +----------+ | Database | +----------+ | m ...
- Linux 操作MySQL常用命令行
1.连接数据库 mysql -uroot -p Enter password: ** Mysql> 出现mysql>说明成功连接到数据 2.显示数据库 mysql> show dat ...
- Linux 常用命令行
Linux常用命令行 第一部分: cd命令 第二部分:文件操作 第三部分:压缩包操作
- Linux - 常用命令行(一)
今天和大家分享一些最基本常用命令行:也是作为新手最应该了解掌握的 ls 命令:用来显示指定工作目录下内容 dir命令:与ls命令一致 cd 命令:变化工作目录 pwd命令:显示用户当前的工作路径,显 ...
- linux应用以及常用命令
各目录作用"/" :Linux文件系统的入口.也是最高一级的目录."/bin":基本系统所需要的命令,功能和"/usr/bin"类似,这个目 ...
- 【No.2】监控Linux性能25个命令行工具
接着上一篇博文继续 [No.1]监控Linux性能25个命令行工具 10:mpstat -- 显示每个CPU的占用情况 该命令可以显示每个CPU的占用情况,如果有一个CPU占用率特别高,那么有可能是一 ...
- 【No.1】监控Linux性能25个命令行工具
如果你的Linux服务器突然负载暴增,告警短信快发爆你的手机,如何在最短时间内找出Linux性能问题所在?通过以下命令或者工具可以快速定位 top vmstat lsof tcpdump netsta ...
- linux vi编辑常用命令
linux vi编辑常用命令 来源:互联网 作者:佚名 时间:07-10 21:31:14 [大 中 小] linux vi编辑常用命令,需要的朋友可以参考下 vi编辑器中有三种状态模式 1. ...
随机推荐
- hdu 3415 Max Sum of Max-K-sub-sequence 单调队列。
Max Sum of Max-K-sub-sequence Time Limit: 2000/1000 MS (Java/Others) Memory Limit: 32768/32768 K ...
- 获取java根目录,加载根目录下的文件
就两句代码 String filepath = System.getProperty("user.dir")+"/a.xlsx"; File file=new ...
- Thymeleaf学习记录(7)--页面引入/片段引入
1.为页面添加footer: Templates文件夹下新建HTML文件: <!DOCTYPE html SYSTEM "http://www.thymeleaf.org/dtd/xh ...
- git杂记-分支简介
分支创建 //只创建分支不切换: $ git branch testing //创建并切换分支$ git checkout -b iss53 查看各个分支的指向对象 $ git log --oneli ...
- bzoj1201: [HNOI2005]数三角形----递推+bitset
-by bzoj http://www.lydsy.com/JudgeOnline/problem.php?id=1201 枚举所有交点,统计每个以每个点为顶点的正三角和和以每个点为左端点的反三角 ...
- 基于 JWT-Auth 实现 API 验证
基于 JWT-Auth 实现 API 验证 如果想要了解其生成Token的算法原理,请自行查阅相关资料 需要提及的几点: 使用session存在的问题: session和cookie是为了解决http ...
- Event percentages解析
Event percentages: 0:--pct-touch//touch events percentage触摸事件百分比(触摸事件是一个在屏幕单一位置的按下-抬起事件) 1:--pct-mot ...
- Week3——Session
Session 一.Session是会话技术的一种.会话技术分为Cookie和Session.Cookie是数据存储在客户端本地,减少服务器端的存储的压力,安全性不好,客户端可以清除cookie: S ...
- 小程序UI
从input组件说起 <input maxlength="10" placeholder="最大输入长度10" /> <div id=&quo ...
- spring cloud config配置
参考: http://www.ityouknow.com/springcloud/2017/05/22/springcloud-config-git.html http://www.ityouknow ...